
A pie chart (or a circle chart) is a circular statistical graphic which is divided into slices to illustrate numerical proportion. In a pie chart, the...
21 KB (2,312 words) - 16:41, 7 June 2024
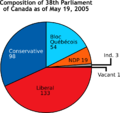
represented by symbols, such as bars in a bar chart, lines in a line chart, or slices in a pie chart". A chart can represent tabular numeric data, functions...
13 KB (1,513 words) - 14:09, 21 July 2024
"American Pie" is a song by American singer and songwriter Don McLean. Recorded and released in 1971 on the album of the same name, the single was the...
91 KB (8,071 words) - 16:36, 15 August 2024

Misleading graph (redirect from Bad chart)
display the data of interest is discouraged for charts in general, not only for pie charts. In a 3D pie chart, the slices that are closer to the reader appear...
37 KB (3,978 words) - 05:11, 22 July 2024
reached number one on the Billboard 200, containing the chart-topping singles "American Pie" and "Vincent". Recorded in May and June 1971 at The Record...
16 KB (1,427 words) - 02:44, 8 August 2024
"Sweetest Pie" is a song by American rapper Megan Thee Stallion and English-Albanian singer Dua Lipa, released on March 11, 2022, through 1501 Certified...
33 KB (2,219 words) - 23:16, 4 August 2024
on the US Billboard 200 album chart, and hit number 20 in the UK and number 9 in Australia. The album was Humble Pie's first following the departure of...
8 KB (723 words) - 13:57, 11 July 2024

Treemapping (redirect from Rectangular pie chart)
York. Disk space analyzer Data and information visualization Marimekko Chart, a similar concept with one level of explicit hierarchy. Li, Rita Yi Man;...
21 KB (2,145 words) - 19:11, 16 July 2024

Humble Pie are an English rock band formed by singer-guitarists Peter Frampton and Steve Marriott in Moreton, Essex,[not verified in body] in 1969. Often...
35 KB (3,621 words) - 13:06, 15 July 2024
Univariate (statistics) (section Pie charts)
with the frequency of values assigned to a value range called a bin. Pie chart is a circle divided into portions that represent the relative frequencies...
12 KB (1,513 words) - 16:24, 14 June 2024