In statistics, rankits of a set of data are the expected values of the order statistics of a sample from the standard normal distribution the same size...
4 KB (406 words) - 22:21, 7 August 2021

approximation to the means or medians of the corresponding order statistics; see rankit. Some plot the data on the vertical axis; others plot the data on the horizontal...
6 KB (782 words) - 05:36, 16 December 2023
a normal score of this type is essentially the same as a rankit, although the term "rankit" is becoming obsolete. In this case the transformation creates...
2 KB (320 words) - 02:37, 9 February 2024
plot Poincaré plot Probability plot correlation coefficient plot Q–Q plot Rankit Run chart Seasonal subseries plot Scatter plot Skewplot Ternary plot Recurrence...
4 KB (331 words) - 07:28, 8 February 2024

Continuous function Monotonic function Quantile function Sigmoid function Rankit analysis, also developed by Chester Bliss Ridit scoring Bliss, C. I. (1934)...
10 KB (1,447 words) - 19:45, 26 April 2024
Normal distribution Normal probability plot – see also rankit Normal score – see also rankit and Z score Normal variance-mean mixture Normal-exponential-gamma...
87 KB (8,280 words) - 10:47, 5 October 2024

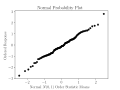
the null hypothesis. Q–Q plot, also known as normal probability plot or rankit plot—is a plot of the sorted values from the data set against the expected...
150 KB (22,467 words) - 21:01, 4 October 2024

case a sorting algorithm can be used and the time taken is O(n log n). Rankit Box plot BRS-inequality Concomitant (statistics) Fisher–Tippett distribution...
25 KB (4,485 words) - 00:21, 19 July 2024
shuffle Order statistic Permutation test Permutational analysis of variance Rankit Resampling (statistics) Seriation (statistics) Golomb–Dickman constant Random...
4 KB (282 words) - 11:52, 17 July 2024

values. In using a normal probability plot, the quantiles one uses are the rankits, the quantile of the expected value of the order statistic of a standard...
21 KB (2,478 words) - 00:12, 3 August 2024