
An area chart or area graph displays graphically quantitative data. It is based on the line chart. The area between axis and line are commonly emphasized...
3 KB (349 words) - 05:12, 16 September 2023

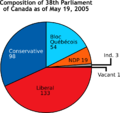
pie chart (or a circle chart) is a circular statistical graphic which is divided into slices to illustrate numerical proportion. In a pie chart, the...
21 KB (2,312 words) - 16:41, 7 June 2024
Timeline chart Organizational chart Tree chart Flow chart Area chart Cartogram Pedigree chart Radial tree Examples of less common charts are: Bubble chart Polar...
13 KB (1,513 words) - 16:24, 2 September 2024
Canada aviation, terminal area charts are aeronautical charts intended for navigation under Visual Flight Rules that depict areas surrounding major airports...
2 KB (249 words) - 05:51, 28 May 2024
navigation charts), and many types in between. Visual flight charts are categorized according to their scale, which is proportional to the size of the area covered...
4 KB (583 words) - 02:48, 15 April 2024
bidental fricative [h̪͆] IPA vowel chart with audio IPA consonant chart with audio International Phonetic Alphabet chart for English dialects Extensions...
12 KB (150 words) - 01:16, 4 June 2024

chart is also known as web chart, spider chart, spider graph, spider web chart, star chart, star plot, cobweb chart, irregular polygon, polar chart,...
20 KB (2,497 words) - 06:58, 17 June 2024

A bar chart or bar graph is a chart or graph that presents categorical data with rectangular bars with heights or lengths proportional to the values that...
10 KB (1,282 words) - 13:51, 4 October 2024

A nautical chart or hydrographic chart is a graphic representation of a sea region or water body and adjacent coasts or banks. Depending on the scale...
17 KB (2,284 words) - 19:32, 18 September 2024
scorecard charts. Area charts are similar to time series charts as users can only set a date or time on the chart's X-axis. The Area Chart, however, has...
17 KB (1,832 words) - 13:23, 4 August 2024