
A line chart or line graph, also known as curve chart, is a type of chart that displays information as a series of data points called 'markers' connected...
5 KB (674 words) - 07:38, 30 March 2024
represented by symbols, such as bars in a bar chart, lines in a line chart, or slices in a pie chart". A chart can represent tabular numeric data, functions...
13 KB (1,513 words) - 16:24, 2 September 2024

"transmission line chart" and other authors first used names like "reflection chart", "circle diagram of impedance", "immittance chart" or "Z-plane chart", early...
68 KB (7,986 words) - 16:24, 15 August 2024
A line break chart, also known as a three-line break chart, is a Japanese trading indicator and chart used to analyze the financial markets. Invented...
6 KB (778 words) - 16:21, 24 June 2024

A bar chart or bar graph is a chart or graph that presents categorical data with rectangular bars with heights or lengths proportional to the values that...
10 KB (1,282 words) - 07:46, 10 June 2024

An area chart or area graph displays graphically quantitative data. It is based on the line chart. The area between axis and line are commonly emphasized...
3 KB (349 words) - 05:12, 16 September 2023

Y, A, C, E, G, L, 2. The normal Snellen chart is printed with eleven lines of block letters. The first line consists of one very large letter, which...
12 KB (1,546 words) - 13:11, 1 April 2024

Ogive (statistics) (redirect from Cumulative line chart)
ogive is obtained by connecting each of the points to its neighbours with line segments. Sometimes an axis for both the absolute frequency and relative...
2 KB (295 words) - 02:31, 14 June 2024
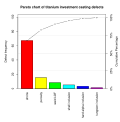
A Pareto chart is a type of chart that contains both bars and a line graph, where individual values are represented in descending order by bars, and the...
4 KB (462 words) - 17:28, 17 July 2024

percent-complete shadings and a vertical "TODAY" line. Gantt charts are sometimes equated with bar charts. Gantt charts are usually created initially using an early...
18 KB (1,798 words) - 17:39, 7 June 2024