
A bar chart or bar graph is a chart or graph that presents categorical data with rectangular bars with heights or lengths proportional to the values that...
10 KB (1,282 words) - 07:46, 10 June 2024
represented by symbols, such as bars in a bar chart, lines in a line chart, or slices in a pie chart". A chart can represent tabular numeric data, functions...
13 KB (1,513 words) - 17:59, 31 May 2024
In industrial statistics, the X-bar chart is a type of Shewhart control chart that is used to monitor the arithmetic means of successive samples of constant...
2 KB (249 words) - 12:21, 17 December 2023

A Gantt chart is a bar chart that illustrates a project schedule. It was designed and popularized by Henry Gantt around the years 1910–1915. Modern Gantt...
18 KB (1,798 words) - 17:39, 7 June 2024

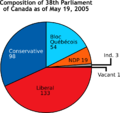
given pie chart, or to compare data across different pie charts. Pie charts can be replaced in most cases by other plots such as the bar chart, box plot...
21 KB (2,312 words) - 16:41, 7 June 2024
daily bar chart this would be the starting price for that day) on the left, and the closing price for that time period on the right. The bars may be...
3 KB (360 words) - 16:57, 25 May 2024

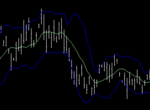
a security, derivative, or currency. While similar in appearance to a bar chart, each candlestick represents four important pieces of information for...
8 KB (1,013 words) - 01:52, 24 June 2024

percent of gross domestic product (GDP) by country. The first table and bar chart lists member countries of the Organisation for Economic Co-operation and...
27 KB (801 words) - 06:14, 22 March 2024
Going. "A Bar Song (Tipsy)" peaked at number one on the Billboard Hot 100. Outside of the United States, "A Bar Song (Tipsy)" topped the charts in Australia...
12 KB (1,011 words) - 19:38, 13 July 2024
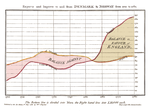
William Playfair (category Statistical charts and diagrams)
several types of diagrams: in 1786 the line, area and bar chart of economic data, and in 1801 the pie chart and circle graph, used to show part-whole relations...
19 KB (2,134 words) - 02:37, 27 June 2024