
 French
 Deutsch
Datei:Mollifier illustration.png – Wikipedia
Es ist keine höhere Auflösung vorhanden.
Mollifier_illustration.png (500 × 158 Pixel, Dateigröße: 6 KB, MIME-Typ: image/png)
![]()
Diese Datei und die Informationen unter dem roten Trennstrich werden aus dem zentralen Medienarchiv Wikimedia Commons eingebunden.
![]()
Beschreibung
 | File:Mollifier Illustration.svg ist eine vektorisierte Version dieses Bildes. Diese sollte an Stelle des Rasterbildes verwendet werden, sofern sie nicht schlechter ist. File:Mollifier illustration.png → File:Mollifier Illustration.svg Für weitere Informationen siehe Help:SVG. |
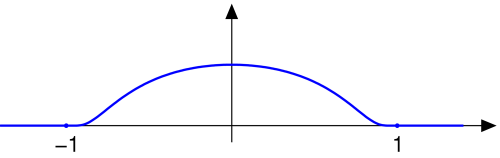
| Beschreibung | Français : fonction mollifiante, C_infini à support compact |
| Quelle | Eigenes Werk |
| Urheber | Oleg Alexandrov 08:56, 19 July 2007 (UTC) |
Lizenz
| Ich, der Urheberrechtsinhaber dieses Werkes, veröffentliche es als gemeinfrei. Dies gilt weltweit. In manchen Staaten könnte dies rechtlich nicht möglich sein. Sofern dies der Fall ist: Ich gewähre jedem das bedingungslose Recht, dieses Werk für jedweden Zweck zu nutzen, es sei denn, Bedingungen sind gesetzlich erforderlich. |
Source code (Matlab)
function main() thickness1=2; thickness2=1; arrowsize=5; arrow_type=2; ball_rad=0.012; blue=[0, 0, 1]; fontsize=25; dist=0.005; a=-1.4; b=-a; h=0.01; X=a:h:b; Y=zeros(length(X), 1); for i=1:length(X) x=X(i); if x < 1 & x > -1 Y(i)=exp(-1/(1-x^2)); end end figure(1); clf; hold on; axis equal; axis off arrow([a 0], [b+0.2, 0], thickness2, arrowsize, pi/8,arrow_type, [0, 0, 0]) arrow([0 -0.1], [0 2.*max(Y)], thickness2, arrowsize, pi/8,arrow_type, [0, 0, 0]) plot(X, Y, 'linewidth', thickness1, 'color', [0 0 1]); arrow([b+0.1 0], [b+0.2, 0], thickness2, arrowsize, pi/8,arrow_type, [0, 0, 0]) ball(1, 0, ball_rad, blue); ball(-1, 0, ball_rad, blue); place_text_smartly(1, fontsize, 6, dist, '1'); place_text_smartly(-1, fontsize, 6, dist, '-1'); saveas(gcf, 'mollifier_illustration.eps', 'psc2') function place_text_smartly (z, fs, pos, d, tx) p=cos(pi/4)+sqrt(-1)*sin(pi/4); z = z + p^pos * d * fs; shiftx=0.0003; shifty=0.002; x = real (z); y=imag(z); H=text(x+shiftx*fs, y+shifty*fs, tx); set(H, 'fontsize', fs, 'HorizontalAlignment', 'c', 'VerticalAlignment', 'c') function ball(x, y, r, color) Theta=0:0.1:2*pi; X=r*cos(Theta)+x; Y=r*sin(Theta)+y; H=fill(X, Y, color); set(H, 'EdgeColor', color); function arrow(start, stop, thickness, arrowsize, sharpness, arrow_type, color) % draw a line with an arrow at the end % start is the x,y point where the line starts % stop is the x,y point where the line stops % thickness is an optional parameter giving the thickness of the lines % arrowsize is an optional argument that will give the size of the arrow % It is assumed that the axis limits are already set % 0 < sharpness < pi/4 determines how sharp to make the arrow % arrow_type draws the arrow in different styles. Values are 0, 1, 2, 3. % 8/4/93 Jeffery Faneuff % Copyright (c) 1988-93 by the MathWorks, Inc. % Modified by Oleg Alexandrov 2/16/03 if nargin <=6 color=[0, 0, 0]; end if (nargin <=5) arrow_type=0; % the default arrow, it looks like this: -> end if (nargin <=4) sharpness=pi/4; % the arrow sharpness - default = pi/4 end if nargin<=3 xl = get(gca,'xlim'); yl = get(gca,'ylim'); xd = xl(2)-xl(1); yd = yl(2)-yl(1); arrowsize = (xd + yd) / 2; % this sets the default arrow size end if (nargin<=2) thickness=0.5; % default thickness end xdif = stop(1) - start(1); ydif = stop(2) - start(2); if (xdif == 0) if (ydif >0) theta=pi/2; else theta=-pi/2; end else theta = atan(ydif/xdif); % the angle has to point according to the slope end if(xdif>=0) arrowsize = -arrowsize; end if (arrow_type == 0) % draw the arrow like two sticks originating from its vertex xx = [start(1), stop(1),(stop(1)+0.02*arrowsize*cos(theta+sharpness)),NaN,stop(1),... (stop(1)+0.02*arrowsize*cos(theta-sharpness))]; yy = [start(2), stop(2), (stop(2)+0.02*arrowsize*sin(theta+sharpness)),NaN,stop(2),... (stop(2)+0.02*arrowsize*sin(theta-sharpness))]; plot(xx,yy, 'LineWidth', thickness, 'color', color) end if (arrow_type == 1) % draw the arrow like an empty triangle xx = [stop(1),(stop(1)+0.02*arrowsize*cos(theta+sharpness)), ... stop(1)+0.02*arrowsize*cos(theta-sharpness)]; xx=[xx xx(1) xx(2)]; yy = [stop(2),(stop(2)+0.02*arrowsize*sin(theta+sharpness)), ... stop(2)+0.02*arrowsize*sin(theta-sharpness)]; yy=[yy yy(1) yy(2)]; plot(xx,yy, 'LineWidth', thickness, 'color', color) % plot the arrow stick plot([start(1) stop(1)+0.02*arrowsize*cos(theta)*cos(sharpness)], [start(2), stop(2)+ ... 0.02*arrowsize*sin(theta)*cos(sharpness)], 'LineWidth', thickness, 'color', color) end if (arrow_type==2) % draw the arrow like a full triangle xx = [stop(1),(stop(1)+0.02*arrowsize*cos(theta+sharpness)), ... stop(1)+0.02*arrowsize*cos(theta-sharpness),stop(1)]; yy = [stop(2),(stop(2)+0.02*arrowsize*sin(theta+sharpness)), ... stop(2)+0.02*arrowsize*sin(theta-sharpness),stop(2)]; % plot the arrow stick plot([start(1) stop(1)+0.01*arrowsize*cos(theta)], [start(2), stop(2)+ ... 0.01*arrowsize*sin(theta)], 'LineWidth', thickness, 'color', color) H=fill(xx, yy, color);% fill with black set(H, 'EdgeColor', 'none') end if (arrow_type==3) % draw the arrow like a filled 'curvilinear' triangle curvature=0.5; % change here to make the curved part more curved (or less curved) radius=0.02*arrowsize*max(curvature, tan(sharpness)); x1=stop(1)+0.02*arrowsize*cos(theta+sharpness); y1=stop(2)+0.02*arrowsize*sin(theta+sharpness); x2=stop(1)+0.02*arrowsize*cos(theta)*cos(sharpness); y2=stop(2)+0.02*arrowsize*sin(theta)*cos(sharpness); d1=sqrt((x1-x2)^2+(y1-y2)^2); d2=sqrt(radius^2-d1^2); d3=sqrt((stop(1)-x2)^2+(stop(2)-y2)^2); center(1)=stop(1)+(d2+d3)*cos(theta); center(2)=stop(2)+(d2+d3)*sin(theta); alpha=atan(d1/d2); Alpha=-alpha:0.05:alpha; xx=center(1)-radius*cos(Alpha+theta); yy=center(2)-radius*sin(Alpha+theta); xx=[xx stop(1) xx(1)]; yy=[yy stop(2) yy(1)]; % plot the arrow stick plot([start(1) center(1)-radius*cos(theta)], [start(2), center(2)- ... radius*sin(theta)], 'LineWidth', thickness, 'color', color); H=fill(xx, yy, color);% fill with black set(H, 'EdgeColor', 'none') end | date/time | username | edit summary |
|---|---|---|
| 04:29, 23 November 2005 | en:User:Oleg Alexandrov | (rm space) |
| 04:27, 23 November 2005 | en:User:Mathbot | (source code) |
| 04:21, 23 November 2005 | en:User:Oleg Alexandrov |
Ursprüngliches Datei-Logbuch
Legend: (cur) = this is the current file, (del) = delete this old version, (rev) = revert to this old version.
Click on date to download the file or see the image uploaded on that date.
- (del) (cur) 04:47, 23 November 2005 . . en:User:Oleg_Alexandrov Oleg Alexandrov ( en:User_talk:Oleg_Alexandrov Talk) . . 500x158 (5669 bytes)
Dateiversionen
Klicke auf einen Zeitpunkt, um diese Version zu laden.
| Version vom | Vorschaubild | Maße | Benutzer | Kommentar | |
|---|---|---|---|---|---|
| aktuell | 21:39, 19. Mär. 2006 | 500 × 158 (6 KB) | Maksim | La bildo estas kopiita de wikipedia:en. La originala priskribo estas: == Licensing == {{PD-self}} ==Source code (Matlab)== <pre><nowiki> function main() thickness1=2; thickness2=1; arrowsize=5; arrow_type=2; ball_rad=0.012; blue=[0, 0, 1]; fo |
Dateiverwendung
Die folgenden 3 Seiten verwenden diese Datei:
Globale Dateiverwendung
Die nachfolgenden anderen Wikis verwenden diese Datei:
- Verwendung auf ca.wikipedia.org
- Verwendung auf en.wikipedia.org
- Verwendung auf en.wikibooks.org
- Verwendung auf it.wikipedia.org
- Verwendung auf ko.wikipedia.org
- Verwendung auf nl.wikipedia.org
- Verwendung auf pt.wikipedia.org
- Verwendung auf sv.wikipedia.org