
 French
 Deutsch
Datei:PR curve with optimal fscore.png – Wikipedia
Es ist keine höhere Auflösung vorhanden.
PR_curve_with_optimal_fscore.png (653 × 547 Pixel, Dateigröße: 36 KB, MIME-Typ: image/png)
![]()
Diese Datei und die Informationen unter dem roten Trennstrich werden aus dem zentralen Medienarchiv Wikimedia Commons eingebunden.
![]()
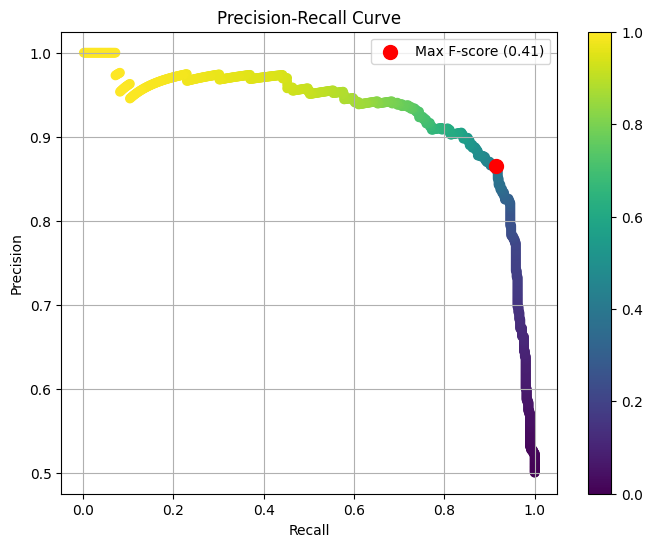
import matplotlib.pyplot as plt import numpy as np from sklearn.datasets import make_classification from sklearn.linear_model import LogisticRegression from sklearn.metrics import precision_recall_curve, f1_score # Generate synthetic data with make_classification X, y_true = make_classification(n_samples=1000, n_features=20, random_state=42) # Create a Logistic Regression model model = LogisticRegression() # Fit the model on the data model.fit(X, y_true) # Predict probabilities for the positive class y_scores = model.predict_proba(X)[:, 1] # Compute precision, recall, and F-score precision, recall, thresholds = precision_recall_curve(y_true, y_scores) f_scores = 2 * (precision * recall) / (precision + recall) # Find the threshold with the maximal F-score max_f_score_idx = np.argmax(f_scores) max_f_score_threshold = thresholds[max_f_score_idx] # Create the PR curve plot plt.figure(figsize=(8, 6)) plt.scatter(recall[:-1], precision[:-1], c=thresholds) plt.scatter(recall[max_f_score_idx], precision[max_f_score_idx], c='red', marker='o', label=f'Max F-score ({max_f_score_threshold:.2f})', s=100) plt.colorbar() plt.xlabel('Recall') plt.ylabel('Precision') plt.title('Precision-Recall Curve') plt.legend() plt.grid(True) plt.show() Beschreibung
| Beschreibung | English: Precision Recall Curve, points from different thresholds are color coded, the point with optimal fscore is highlighted in red |
| Datum | |
| Quelle | Eigenes Werk |
| Urheber | Biggerj1 |
Lizenz
Ich, der Urheber dieses Werkes, veröffentliche es unter der folgenden Lizenz:
Diese Datei ist lizenziert unter der Creative-Commons-Lizenz „Namensnennung – Weitergabe unter gleichen Bedingungen 4.0 international“.
- Dieses Werk darf von dir
- verbreitet werden – vervielfältigt, verbreitet und öffentlich zugänglich gemacht werden
- neu zusammengestellt werden – abgewandelt und bearbeitet werden
- Zu den folgenden Bedingungen:
- Namensnennung – Du musst angemessene Urheber- und Rechteangaben machen, einen Link zur Lizenz beifügen und angeben, ob Änderungen vorgenommen wurden. Diese Angaben dürfen in jeder angemessenen Art und Weise gemacht werden, allerdings nicht so, dass der Eindruck entsteht, der Lizenzgeber unterstütze gerade dich oder deine Nutzung besonders.
- Weitergabe unter gleichen Bedingungen – Wenn du das Material wiedermischst, transformierst oder darauf aufbaust, musst du deine Beiträge unter der gleichen oder einer kompatiblen Lizenz wie das Original verbreiten.
Dateiversionen
Klicke auf einen Zeitpunkt, um diese Version zu laden.
| Version vom | Vorschaubild | Maße | Benutzer | Kommentar | |
|---|---|---|---|---|---|
| aktuell | 13:38, 9. Sep. 2023 | | 653 × 547 (36 KB) | Biggerj1 | Uploaded own work with UploadWizard |
Dateiverwendung
Die folgenden 2 Seiten verwenden diese Datei:
Globale Dateiverwendung
Die nachfolgenden anderen Wikis verwenden diese Datei:
- Verwendung auf en.wikipedia.org