1855 California gubernatorial election
| |||||||||||||||||
| |||||||||||||||||
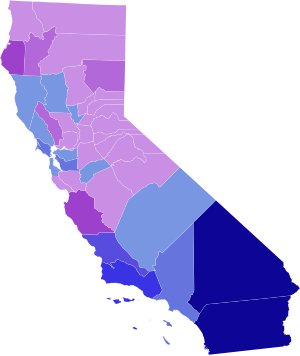
 County results Johnson: 50-60% 60-70% 70-80% Bigler: 50–60% 60–70% 70–80% 80–90% >90% | |||||||||||||||||
| |||||||||||||||||
| Elections in California |
|---|
 |
The 1855 California gubernatorial election was held on September 5, 1855, to elect the governor of California. Incumbent governor John Bigler lost his bid for reelection.
Results
[edit]| Party | Candidate | Votes | % | ±% | |
|---|---|---|---|---|---|
| Know Nothing | J. Neely Johnson | 51,157 | 52.52% | +52.52% | |
| Democratic | John Bigler (incumbent) | 46,220 | 47.45% | −3.52% | |
| Scattering | 21 | 0.02% | |||
| Majority | 4,937 | 5.07% | |||
| Total votes | 97,398 | 100.00% | |||
| Know Nothing gain from Democratic | Swing | +7.01% | |||
Results by county
[edit]| County | J. Neely Johnson Know Nothing | John Bigler Democratic | Scattering Write-in | Margin | Total votes cast[1] | ||||
|---|---|---|---|---|---|---|---|---|---|
| # | % | # | % | # | % | # | % | ||
| Alameda | 625 | 36.49% | 1,088 | 63.51% | 0 | 0.00% | -463 | -27.03% | 1,713 |
| Amador | 2,035 | 54.21% | 1,719 | 45.79% | 0 | 0.00% | 316 | 8.42% | 3,754 |
| Butte | 1,694 | 54.56% | 1,411 | 45.44% | 0 | 0.00% | 283 | 9.11% | 3,105 |
| Calaveras | 2,186 | 49.61% | 2,220 | 50.39% | 0 | 0.00% | -34 | -0.77% | 4,406 |
| Colusa | 359 | 55.92% | 283 | 44.08% | 0 | 0.00% | 76 | 11.84% | 642 |
| Contra Costa | 360 | 46.94% | 407 | 53.06% | 0 | 0.00% | -47 | -6.13% | 767 |
| El Dorado | 4,929 | 55.51% | 3,948 | 44.46% | 3 | 0.03% | 981 | 11.05% | 8,880 |
| Humboldt | 282 | 78.55% | 77 | 21.45% | 0 | 0.00% | 205 | 57.10% | 359 |
| Klamath | 545 | 53.07% | 482 | 46.93% | 0 | 0.00% | 63 | 6.13% | 1,027 |
| Los Angeles | 556 | 37.59% | 923 | 62.41% | 0 | 0.00% | -367 | -24.81% | 1,479 |
| Marin | 173 | 34.19% | 333 | 65.81% | 0 | 0.00% | -160 | -31.62% | 506 |
| Mariposa | 1,255 | 56.56% | 964 | 43.44% | 0 | 0.00% | 291 | 13.11% | 2,219 |
| Merced | 102 | 54.55% | 85 | 45.45% | 0 | 0.00% | 17 | 9.09% | 187 |
| Monterey | 485 | 72.93% | 180 | 27.07% | 0 | 0.00% | 305 | 45.86% | 665 |
| Napa | 519 | 66.54% | 261 | 33.46% | 0 | 0.00% | 258 | 33.08% | 780 |
| Nevada | 2,861 | 53.32% | 2,502 | 46.63% | 3 | 0.06% | 359 | 6.69% | 5,366 |
| Placer | 3,128 | 57.50% | 2,312 | 42.50% | 0 | 0.00% | 816 | 15.00% | 5,440 |
| Plumas | 1,111 | 60.15% | 736 | 39.85% | 0 | 0.00% | 375 | 20.30% | 1,847 |
| Sacramento | 3,544 | 54.89% | 2,912 | 45.11% | 0 | 0.00% | 632 | 9.79% | 6,456 |
| San Bernardino | 14 | 4.05% | 332 | 95.95% | 0 | 0.00% | -318 | -91.91% | 346 |
| San Diego | 17 | 7.66% | 204 | 91.89% | 1 | 0.45% | -187 | -84.23% | 222 |
| San Francisco | 5,213 | 42.21% | 7,138 | 57.79% | 0 | 0.00% | -1,925 | -15.59% | 12.351 |
| San Joaquin | 1,447 | 58.51% | 1,026 | 41.49% | 0 | 0.00% | 421 | 17.02% | 2,473 |
| San Luis Obispo | 45 | 27.61% | 118 | 72.39% | 0 | 0.00% | -73 | -44.79% | 163 |
| Santa Barbara | 39 | 10.46% | 333 | 89.28% | 1 | 0.27% | -294 | -78.82% | 373 |
| Santa Clara | 1,135 | 53.14% | 994 | 46.54% | 7 | 0.33% | 141 | 6.60% | 2,136 |
| Santa Cruz | 347 | 57.64% | 255 | 42.36% | 0 | 0.00% | 92 | 15.28% | 602 |
| Shasta | 1,418 | 52.11% | 1,302 | 47.85% | 1 | 0.04% | 116 | 4.26% | 2,721 |
| Sierra | 3,070 | 58.83% | 2,148 | 41.17% | 0 | 0.00% | 922 | 17.67% | 5,218 |
| Siskiyou | 2,045 | 59.92% | 1,368 | 40.08% | 0 | 0.00% | 677 | 19.84% | 3,413 |
| Solano | 753 | 56.03% | 591 | 43.97% | 0 | 0.00% | 162 | 12.05% | 1,344 |
| Sonoma | 892 | 48.82% | 933 | 51.07% | 2 | 0.11% | -41 | -2.24% | 1,827 |
| Stanislaus | 225 | 42.94% | 299 | 57.06% | 0 | 0.00% | -74 | -14.12% | 524 |
| Sutter | 340 | 47.16% | 381 | 52.84% | 0 | 0.00% | -41 | -5.69% | 721 |
| Trinity | 1,132 | 68.65% | 517 | 31.35% | 0 | 0.00% | 615 | 37.30% | 1,649 |
| Tulare | 140 | 40.70% | 204 | 59.30% | 0 | 0.00% | -64 | -18.60% | 344 |
| Tuolumne | 2,805 | 53.95% | 2,391 | 45.99% | 3 | 0.06% | 414 | 7.96% | 5,199 |
| Yolo | 603 | 51.85% | 560 | 48.15% | 0 | 0.00% | 43 | 3.70% | 1,163 |
| Yuba | 2,728 | 54.44% | 2,283 | 45.56% | 0 | 0.00% | 445 | 8.88% | 5,011 |
| Total | 51,157 | 52.52% | 46,220 | 47.45% | 21 | 0.02% | 4,937 | 5.07% | 97,398 |
Counties that flipped from Democratic to Know Nothing
[edit]- El Dorado
- Mariposa
- Monterey
- Nevada
- Placer
- San Joaquin
- Shasta
- Sierra
- Siskiyou
- Solano
- Trinity
- Tuolumne
- Yuba
Counties that flipped from Whig to Know Nothing
[edit]Counties that flipped from Whig to Democratic
[edit]References
[edit]


 French
 Deutsch
