1952 Swedish general election
| ||||||||||||||||||||||||||||||||||||||||||||||||||||||||||||||||||||
All 230 seats in the Andra kammaren of the Riksdag 116 seats needed for a majority | ||||||||||||||||||||||||||||||||||||||||||||||||||||||||||||||||||||
|---|---|---|---|---|---|---|---|---|---|---|---|---|---|---|---|---|---|---|---|---|---|---|---|---|---|---|---|---|---|---|---|---|---|---|---|---|---|---|---|---|---|---|---|---|---|---|---|---|---|---|---|---|---|---|---|---|---|---|---|---|---|---|---|---|---|---|---|---|
| ||||||||||||||||||||||||||||||||||||||||||||||||||||||||||||||||||||
 Largest bloc and seats won by constituency | ||||||||||||||||||||||||||||||||||||||||||||||||||||||||||||||||||||
| ||||||||||||||||||||||||||||||||||||||||||||||||||||||||||||||||||||
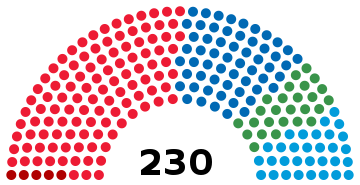
General elections were held in Sweden on 21 September 1952.[1] The Social Democrats remained the largest party with 110 of the 230 seats in the Andra kammaren of the Riksdag and together with the Communist Party of Sweden they got 115 seats and the other parties 115 seats.[2] Tage Erlander and his Social Democratic Party did however form his second government with the Farmers' League already in 1951 and together with that party the Social Democrats now had a majority of 136 seats in the chamber and together with the Communists 141 seats. In the other indirectly elected chamber the Social Democrats had an absolute majority.
The Catalina affair had taken place a few months prior to the election and was highly debated during the time.
Results
[edit] | |||||
|---|---|---|---|---|---|
| Party | Votes | % | Seats | +/– | |
| Swedish Social Democratic Party | 1,742,284 | 46.05 | 110 | –2 | |
| People's Party | 924,819 | 24.44 | 58 | +1 | |
| Right Party | 543,825 | 14.37 | 31 | +8 | |
| Farmers' League | 406,183 | 10.74 | 26 | –4 | |
| Communist Party | 164,194 | 4.34 | 5 | –3 | |
| Left Socialist Party | 2,302 | 0.06 | 0 | 0 | |
| Other parties | 100 | 0.00 | 0 | 0 | |
| Total | 3,783,707 | 100.00 | 230 | 0 | |
| Valid votes | 3,783,707 | 99.54 | |||
| Invalid/blank votes | 17,577 | 0.46 | |||
| Total votes | 3,801,284 | 100.00 | |||
| Registered voters/turnout | 4,805,216 | 79.11 | |||
| Source: Nohlen & Stöver | |||||
References
[edit]- ^ Dieter Nohlen & Philip Stöver (2010) Elections in Europe: A data handbook, p1858 ISBN 978-3-8329-5609-7
- ^ Nohlen & Stöver, p1872


 French
 Deutsch


