Part of the 2024 Irish local elections
2024 Kilkenny County Council election|
|
|
| |
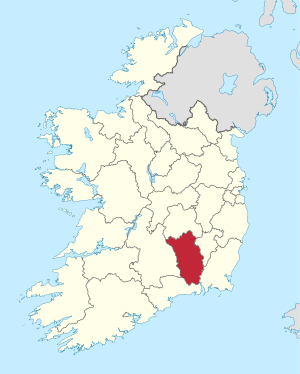 Area of Kilkenny County Council |
An election to all 24 seats on Kilkenny County Council was held on 7 June 2024 as part of the 2024 Irish local elections.[1] County Kilkenny is divided into 4 local electoral areas (LEAs) to elect councillors for a five-year term of office on the electoral system of proportional representation by means of the single transferable vote (PR-STV).[2]
Retiring incumbents
[edit]The following councillors did not seek re-election:
^ *: Outgoing councillor elected in 2019.
^ †: Outgoing councillor coopted subsequent to the 2019 election.
Candidates by local electoral area
[edit] Callan–Thomastown: 6 seats[5][6] | Party | Candidate | FPv% | Count |
| 1 | 2 | 3 | 4 | 5 | 6 |
| | Fianna Fáil | Peter Cleere[*] | 19.02% | 2,057 | | | | | |
| | Fianna Fáil | Joe Sheridan | 18.38% | 1,988 | | | | | |
| | Fine Gael | Joe Lyons[*] | 14.99% | 1,621 | | | | | |
| | Fine Gael | Michael Doyle[*] | 12.41% | 1,342 | 1,519 | 1,558 | | | |
| | Fianna Fáil | Deirdre Cullen[*] | 11.17% | 1,208 | 1,441 | 1,699 | | | |
| | Sinn Féin | Stephanie Doheny | 7.97% | 862 | 891 | 935 | 960 | 1,068 | 1,442 |
| | Fine Gael | Orla Kelly | 7.53% | 814 | 860 | 921 | 983 | 1,156 | 1,217 |
| | Sinn Féin | David Kennedy | 4.91% | 531 | 547 | 569 | 577 | 600 | |
| | Green | Kristina Doyle | 3.64% | 394 | 404 | 422 | 446 | | |
| Electorate: 20,510 Valid: 10,817 Spoilt: 215 Quota: 1546 Turnout: 11,032 (53.79%) |
Castlecomer: 6 seats[5][7] | Party | Candidate | FPv% | Count |
| 1 | 2 | 3 | 4 | 5 |
| | Fianna Fáil | Pat Fitzpatrick[*] | 21.90% | 2,308 | | | | |
| | Fine Gael | Mary Hilda Cavanagh[*] | 17.69% | 1,865 | | | | |
| | Fianna Fáil | Michael McCarthy[*] | 14.13% | 1,489 | 1,678 | | | |
| | Independent | Maurice Shortall | 10.94% | 1,153 | 1,284 | 1,308 | 1,332 | 1,654 |
| | Fine Gael | John Brennan[*] | 10.70% | 1,128 | 1,339 | 1,511 | | |
| | Sinn Féin | Denis Hynes[*] | 9.68% | 1,020 | 1,082 | 1,101 | 1,114 | 1,172 |
| | Fianna Fáil | Michael Delaney[*] | 9.37% | 988 | 1,154 | 1,266 | 1,374 | 1,463 |
| | Independent Ireland | Daniel Burke | 3.36% | 354 | 388 | 404 | 411 | |
| | The Irish People | Stephen Delaney | 2.23% | 235 | 244 | 260 | 260 | |
| Electorate: 19,995 Valid: 10,540 Spoilt: 138 Quota: 1,506 Turnout: 10,678 (53.40%) |
Kilkenny: 7 seats[5][8] | Party | Candidate | FPv% | Count |
| 1 | 2 | 3 | 4 | 5 | 6 | 7 | 8 | 9 | 10 | 11 | 12 | 13 | 14 | 15 |
| | Fianna Fáil | Andrew McGuinness[*] | 14.52% | 1,420 | | | | | | | | | | | | | | |
| | Fine Gael | David Fitzgerald[*] | 12.59% | 1,231 | | | | | | | | | | | | | | |
| | Independent | Eugene McGuinness[*] | 11.61% | 1,136 | 1,170 | 1,170 | 1,189 | 1,192 | 1,199 | 1,208 | 1,235 | | | | | | | |
| | Fianna Fáil | Joe Malone[*] | 10.64% | 1,041 | 1,114 | 1,116 | 1,118 | 1,130 | 1,135 | 1,139 | 1,164 | 1,179 | 1,204 | 1,205 | 1,239 | | | |
| | Fianna Fáil | John Coonan[*] | 7.13% | 697 | 721 | 721 | 724 | 728 | 731 | 731 | 738 | 742 | 770 | 772 | 782 | 821 | 1,020 | 1,078 |
| | Labour | Seán Ó hArgáin | 6.72% | 657 | 669 | 669 | 669 | 671 | 677 | 678 | 691 | 700 | 814 | 816 | 832 | 881 | 1,015 | 1,106 |
| | Green | Maria Dollard[†] | 6.08% | 595 | 601 | 602 | 604 | 606 | 616 | 618 | 632 | 641 | 683 | 684 | 690 | 767 | 832 | 891 |
| | Social Democrats | Martin O'Neill | 5.36% | 524 | 530 | 531 | 533 | 533 | 560 | 561 | 568 | 583 | 611 | 612 | 640 | 687 | 725 | 856 |
| | Fine Gael | Martin Brett[*] | 4.99% | 488 | 504 | 506 | 506 | 507 | 508 | 509 | 531 | 534 | 559 | 559 | 569 | 603 | | |
| | Sinn Féin | Evan Barry | 3.77% | 369 | 375 | 377 | 378 | 382 | 386 | 428 | 432 | 589 | 603 | 603 | 626 | 669 | 687 | |
| | Independent | Toluwani Akaehomen | 3.30% | 323 | 327 | 328 | 329 | 341 | 346 | 350 | 361 | 373 | 390 | 391 | 413 | | | |
| | Irish Freedom | Luke O’Connor | 3.16% | 309 | 311 | 313 | 327 | 327 | 333 | 335 | 342 | 348 | 349 | 353 | | | | |
| | Labour | Andrea Cleere | 2.99% | 292 | 298 | 298 | 298 | 298 | 300 | 302 | 313 | 326 | | | | | | |
| | Sinn Féin | Aoife O'Brien | 1.96% | 192 | 193 | 193 | 193 | 205 | 215 | 271 | 272 | | | | | | | |
| | Independent | Liam Heffernan | 1.56% | 153 | 155 | 156 | 158 | 159 | 161 | 163 | | | | | | | | |
| | Sinn Féin | Mark O’Farrell | 1.33% | 130 | 132 | 132 | 135 | 137 | 138 | | | | | | | | | |
| | People Before Profit | Kevin Shore | 0.91% | 89 | 90 | 92 | 93 | 95 | | | | | | | | | | |
| | Independent | Jony Aza | 0.66% | 65 | 66 | 67 | 67 | | | | | | | | | | | |
| | Independent | Michael McGrath | 0.53% | 52 | 53 | 54 | | | | | | | | | | | | |
| | Independent | Noel Gerald Walsh | 0.18% | 18 | 18 | | | | | | | | | | | | | |
| Electorate: 20,706 Valid: 9,781 Spoilt: 128 Quota: 1,223 Turnout: 9,909 (47.86%) |
Piltown: 5 seats[5] | Party | Candidate | FPv% | Count |
| 1 | 2 | 3 | 4 | 5 | 6 | 7 | 8 | 9 |
| | Fine Gael | Patrick Dunphy[*] | 21.96% | 1,874 | | | | | | | | |
| | Labour | Tomás Breathnach[*] | 17.04% | 1,454 | | | | | | | | |
| | Fianna Fáil | Ger Frisby[*] | 11.28% | 963 | 991 | 999 | 1,019 | 1,023 | 1,048 | 1,150 | 1,193 | 1,351 |
| | Fine Gael | Fidelis Doherty[*] | 11.10% | 947 | 1,055 | 1,074 | 1,095 | 1,101 | 1,119 | 1,253 | 1,278 | 1,381 |
| | Fianna Fáil | Jenny Slattery Catt | 9.51% | 812 | 858 | 868 | 874 | 880 | 891 | 920 | 935 | 1,178 |
| | Fianna Fáil | Maria Wall | 6.25% | 533 | 682 | 702 | 756 | 762 | 779 | 804 | 811 | |
| | Sinn Féin | Natasha Newsome Drennan | 5.85% | 499 | 527 | 540 | 607 | 611 | 655 | 686 | 992 | 1,087 |
| | Sinn Féin | Michael Wemyss | 4.50% | 384 | 391 | 395 | 413 | 415 | 440 | 468 | | |
| | The Irish People | Richard Daly | 4.31% | 368 | 376 | 377 | 392 | 393 | | | | |
| | Fine Gael | Damien Donoghue | 4.19% | 358 | 394 | 400 | 422 | 424 | 433 | | | |
| | Social Democrats | David Kane | 2.65% | 226 | 257 | 282 | | | | | | |
| | Green | Benny McDonagh | 1.36% | 116 | 126 | | | | | | | |
| Electorate: 17,132 Valid: 8,534 Spoilt: 96 Quota: 1,423 Turnout: 8,630 (50.37%) |

 French
 Deutsch