Demographics of Leeds
| Demographics of Leeds | |
|---|---|
 Population pyramid of Leeds | |
| Population | 751,485 (2011) |
| Density | 1,388 people per square km. |

Leeds, England is the third most populous city in the United Kingdom.
Population
[edit]Leeds's total population, according to the 2011 UK census, was 751,485. The population density was 1,388 people per square km.
Ethnicity
[edit]

The following table shows the ethnic group of respondents in the 2001 and 2011 censuses in Leeds.
A Home Office report officially estimated that the 'coloured' population of Leeds in 1958 was likely around 3,000 to 5,000, the majority of these being Afro-Caribbean (2,000).[1]
| Ethnic Group | 1971 estimations[2] | 1981 estimations[3] | 1991[4] | 2001[5] | 2011[6] | 2021[7] | ||||||
|---|---|---|---|---|---|---|---|---|---|---|---|---|
| Number | % | Number | % | Number | % | Number | % | Number | % | Number | % | |
| White: Total | 772,062 | 97.9% | 660,754 | 96% | 640,997 | 94.16% | 657,082 | 91.85% | 639,487 | 85.10% | 641,801 | 79% |
| White: British | – | – | – | – | – | – | 637,872 | 89.16% | 609,714 | 81.13% | 595,737 | 73.4% |
| White: Irish | – | – | – | – | 9,163 | 1.34% | 8,578 | 1.20% | 7,031 | 0.94% | 6,892 | 0.8% |
| White: Gypsy or Irish Traveller[note 1] | – | – | – | – | – | – | – | – | 687 | 0.09% | 878 | 0.1% |
| White: Roma | – | – | – | – | – | – | – | – | – | – | 1,610 | 0.2% |
| White: Other | – | – | – | – | – | – | 10,632 | 1.49% | 22,055 | 2.93% | 36,684 | 4.5% |
| Asian or Asian British: Total | – | – | – | – | 24,602 | 3.61% | 35,737 | 5.00% | 58,243 | 7.75% | 78,503 | 9.7% |
| Asian or Asian British: Indian | – | – | – | – | 9,900 | 12,303 | 1.72% | 16,130 | 2.15% | 21,087 | 2.6% | |
| Asian or Asian British: Pakistani | – | – | – | – | 9,329 | 15,064 | 2.11% | 22,492 | 2.99% | 31,405 | 3.9% | |
| Asian or Asian British: Bangladeshi | – | – | – | – | 1,759 | 2,537 | 0.35% | 4,432 | 0.59% | 5,876 | 0.7% | |
| Asian or Asian British: Chinese[note 2] | – | – | – | – | 2,066 | 3,447 | 0.48% | 5,933 | 0.79% | 8,117 | 1.0% | |
| Asian or Asian British: Other Asian | – | – | – | – | 1,548 | 2,386 | 0.33% | 9,256 | 1.23% | 12,018 | 1.5% | |
| Black or Black British: Total | – | – | – | – | 10,815 | 1.58% | 10,318 | 1.44% | 25,893 | 3.45% | 45,376 | 5.6% |
| Black or Black British: African | – | – | – | – | 1,343 | 2,435 | 0.34% | 14,894 | 1.98% | 32,211 | 4.0% | |
| Black or Black British: Caribbean | – | – | – | – | 6,554 | 6,718 | 0.94% | 6,728 | 0.90% | 7,889 | 1.0% | |
| Black or Black British: Other Black | – | – | – | – | 2,918 | 1,165 | 0.16% | 4,271 | 0.57% | 5,276 | 0.6% | |
| Mixed: Total | – | – | – | – | – | – | 9,737 | 1.36% | 19,632 | 2.61% | 27,388 | 3.3% |
| Mixed: White and Black Caribbean | – | – | – | – | – | – | 4,603 | 0.64% | 8,813 | 1.17% | 10,028 | 1.2% |
| Mixed: White and Black African | – | – | – | – | – | – | 885 | 0.12% | 2,493 | 0.33% | 4,294 | 0.5% |
| Mixed: White and Asian | – | – | – | – | – | – | 2,516 | 0.35% | 4,906 | 0.65% | 7,410 | 0.9% |
| Mixed: Other Mixed | – | – | – | – | – | – | 1,733 | 0.24% | 3,420 | 0.46% | 5,656 | 0.7% |
| Other: Total | – | – | – | – | 4,308 | 0.63% | 2,528 | 0.35% | 8,230 | 1.10% | 18,885 | 2.3% |
| Other: Arab[note 3] | – | – | – | – | – | – | – | – | 3,791 | 0.50% | 5,980 | 0.7% |
| Other: Any other ethnic group | – | – | – | – | 4,308 | 0.63% | 2,528 | 0.35% | 4,439 | 0.59% | 12,905 | 1.6% |
| Non-White: Total | 16,938 | 2.1% | 27,807 | 4% | 39,725 | 5.8% | 58,320 | 8.1% | 111,998 | 14.9% | 170,152 | 21% |
| Total | 789,000 | 100% | 688,561 | 100% | 680,722 | 100% | 715,402 | 100% | 751,485 | 100% | 811,953 | 100% |
Notes for table above
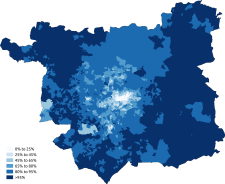
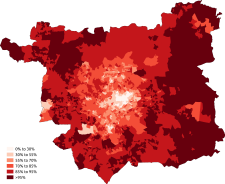
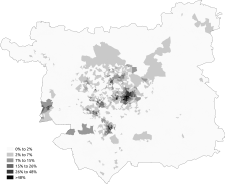
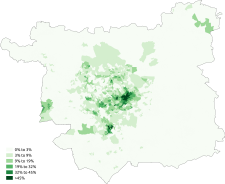
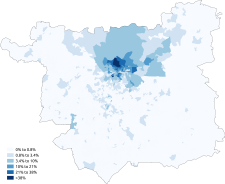
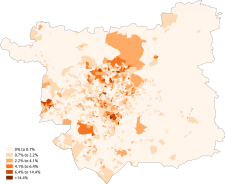
Distribution of ethnic groups in the Leeds Metropolitan District Council area according to the 2011 census.
Languages
[edit]The most common main languages spoken in Leeds according to the 2011 census are shown below.[8]
| Rank | Language | Usual residents aged 3+ | Proportion |
|---|---|---|---|
| 1 | English | 670,650 | 92.90% |
| 2 | Polish | 6,717 | 0.93% |
| 3 | Urdu | 4,989 | 0.69% |
| 4 | Punjabi | 4,537 | 0.63% |
| 5 | Arabic | 3,393 | 0.47% |
| 6 | Bengali (with Sylheti and Chatgaya) | 1,955 | 0.27% |
| 7 | Kurdish | 1,772 | 0.25% |
| 8 | French | 1,724 | 0.24% |
| 9 | Persian | 1,623 | 0.22% |
| 10 | Portuguese | 1,260 | 0.17% |
| 11 | Tigrinya | 904 | 0.13% |
| 12 | Spanish | 851 | 0.12% |
| 13 | Lithuanian | 842 | 0.12% |
| 14 | Shona | 793 | 0.11% |
| 15 | Gujarati | 760 | 0.11% |
| 16 | Russian | 737 | 0.10% |
| 17 | Greek | 726 | 0.10% |
| 18 | Czech | 707 | 0.10% |
| 19 | Hindi | 705 | 0.10% |
| 20 | Cantonese Chinese | 704 | 0.10% |
| Other | 15,522 | 2.15% |
Religion
[edit]
The following table shows the religion of respondents in recent censuses in Leeds.
| Religion | 2001[9] | 2011[10] | 2021[11] | |||
|---|---|---|---|---|---|---|
| Number | % | Number | % | Number | % | |
| Christian | 492,656 | 68.86% | 419,790 | 55.86% | 343,311 | 42.28% |
| Muslim | 21,394 | 2.99% | 40,772 | 5.43% | 63,054 | 7.77% |
| Sikh | 7,586 | 1.06% | 8,914 | 1.19% | 10,047 | 1.24% |
| Hindu | 4,183 | 0.58% | 7,048 | 0.94% | 9,217 | 1.14% |
| Jewish | 8,267 | 1.16% | 6,847 | 0.91% | 6,267 | 0.77% |
| Buddhist | 1,587 | 0.22% | 2,772 | 0.37% | 2,874 | 0.35% |
| Other religion | 1,530 | 0.21% | 2,396 | 0.32% | 3,637 | 0.45% |
| No religion | 120,139 | 16.79% | 212,229 | 28.24% | 326,231 | 40.18% |
| Religion not stated | 58,060 | 8.12% | 50,717 | 6.75% | 47,315 | 5.83% |
| Total | 715,402 | 100.00% | 751,485 | 100.00% | 811,953 | 100.00% |
Religion in Leeds (2021)[12]
Christianity (42.28%)
No Religion (40.18%)
Islam (7.77%)
Sikhism (1.24%)
Hinduism (1.14%)
Judaism (0.77%)
Buddhism (0.35%)
Other Religions (0.45%)
Religion not Stated (5.83%)
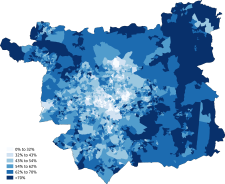
Distribution of religions in the Leeds Metropolitan District Council area according to the 2011 census.
See also
[edit]- Demographics of West Yorkshire
- Demographics of the United Kingdom
- Demographics of England
- Demographics of London
- Demographics of Birmingham
- Demographics of Greater Manchester
- List of English cities by population
- List of English districts by population
- List of English districts and their ethnic composition
- List of English districts by area
- List of English districts by population density
References
[edit]- ^ J. A.G. Griffith, Judith Henderson (1960). Coloured Immigrants in Britain. Internet Archive. Oxford University Press. p. 15.
- ^ Jones, P. N. (1978). "The Distribution and Diffusion of the Coloured Population in England and Wales, 1961-71". Transactions of the Institute of British Geographers. 3 (4): 515–532. Bibcode:1978TrIBG...3..515J. doi:10.2307/622127. ISSN 0020-2754. JSTOR 622127. PMID 12157820.
- ^ Equality, Commission for Racial (1985). "Ethnic minorities in Britain: statistical information on the pattern of settlement". Commission for Racial Equality: Table 2.2.
- ^ Data is taken from United Kingdom Casweb Data services of the United Kingdom 1991 Census on Ethnic Data for England, Scotland and Wales Archived 5 April 2022 at the Wayback Machine (Table 6)
- ^ "Office of National Statistics; 2001 Census Key Statistics". webarchive.nationalarchives.gov.uk. Retrieved 7 September 2021.
- ^ "2011 Census: Ethnic Group, local authorities in England and Wales". webarchive.nationalarchives.gov.uk. Retrieved 15 December 2021.
- ^ "Ethnic group - Office for National Statistics". www.ons.gov.uk. Retrieved 29 November 2022.
- ^ "Download:local authorities: county / unitary". NOMIS. Retrieved 17 June 2015.
- ^ "2001 census - theme tables". Retrieved 17 June 2015.
- ^ "Download:local authorities: county / unitary". NOMIS. Retrieved 17 June 2015.
- ^ "Religion". ONS. Retrieved 5 December 2022.
- ^ "How life has changed in Leeds: Census 2021". gov.uk.


 French
 Deutsch