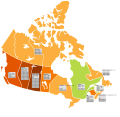
File:Canada GHG map 2008-en.svg

Size of this PNG preview of this SVG file: 619 × 600 pixels. Other resolutions: 248 × 240 pixels | 496 × 480 pixels | 793 × 768 pixels | 1,057 × 1,024 pixels | 2,114 × 2,048 pixels | 1,304 × 1,263 pixels.
Original file (SVG file, nominally 1,304 × 1,263 pixels, file size: 145 KB)
File history
Click on a date/time to view the file as it appeared at that time.
| Date/Time | Thumbnail | Dimensions | User | Comment | |
|---|---|---|---|---|---|
| current | 18:05, 15 August 2010 |  | 1,304 × 1,263 (145 KB) | Bouchecl | Carriage returns missing for NL, NS and ON boxes |
| 18:02, 15 August 2010 |  | 1,304 × 1,263 (145 KB) | Bouchecl | {{Information |Description={{en|Map of Canada showing the increases in GHG emissions by province/territory in 2008, compared to the 1990 base year. {{legend|#973700|50%+ increase}} {{legend|#bf4800|30%-50% increase}} {{legend|#e45500|20%-30% increase}} {{ |
File usage
The following 3 pages use this file:
Global file usage
The following other wikis use this file:
- Usage on es.wikipedia.org
- Usage on fr.wikipedia.org


 French
 Deutsch