
 French
 Deutsch
File:Diagram showing the lymph nodes lymphoma most commonly develops in CRUK 311.svg

Size of this PNG preview of this SVG file: 375 × 438 pixels. Other resolutions: 205 × 240 pixels | 411 × 480 pixels | 657 × 768 pixels | 877 × 1,024 pixels | 1,753 × 2,048 pixels.
Original file (SVG file, nominally 375 × 438 pixels, file size: 107 KB)
| This is a file from the Wikimedia Commons. Information from its description page there is shown below. Commons is a freely licensed media file repository. You can help. |
Summary
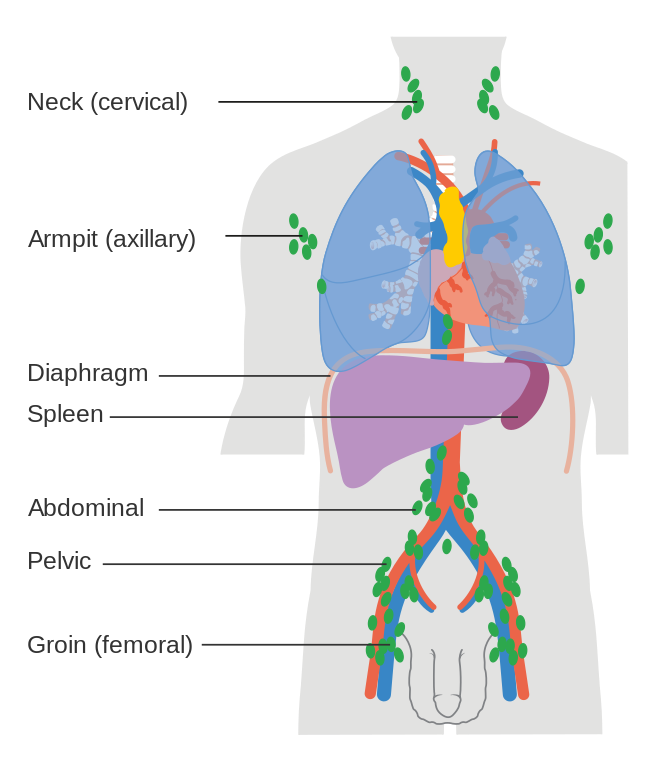
| Description | Diagram showing the lymph nodes lymphoma most commonly develops in. |
| Date | 30 July 2014 (released by CRUK) |
| Source | Original email from CRUK |
| Author | Cancer Research UK |
| Permission (Reusing this file) | This image has been released as part of an open knowledge project by Cancer Research UK. If re-used, attribute to Cancer Research UK / Wikimedia Commons |
| Other versions | file:Diagram showing the lymph nodes lymphoma most commonly develops in CRUK 311-ar.png |
Licensing
This file is licensed under the Creative Commons Attribution-Share Alike 4.0 International license.
- You are free:
- to share – to copy, distribute and transmit the work
- to remix – to adapt the work
- Under the following conditions:
- attribution – You must give appropriate credit, provide a link to the license, and indicate if changes were made. You may do so in any reasonable manner, but not in any way that suggests the licensor endorses you or your use.
- share alike – If you remix, transform, or build upon the material, you must distribute your contributions under the same or compatible license as the original.
File history
Click on a date/time to view the file as it appeared at that time.
| Date/Time | Thumbnail | Dimensions | User | Comment | |
|---|---|---|---|---|---|
| current | 06:29, 24 November 2023 | | 375 × 438 (107 KB) | MdsShakil | File uploaded using svgtranslate tool (https://svgtranslate.toolforge.org/). Added translation for bn. |
| 12:03, 14 January 2016 |  | 375 × 438 (106 KB) | Cancer Research UK uploader | updated diagram style | |
| 14:51, 30 July 2014 |  | 343 × 399 (145 KB) | Fæ | =={{int:filedesc}}== {{information | description = Diagram showing the lymph nodes lymphoma most commonly develops in. | date = {{ISOdate|2014-07-30}} (released by CRUK) | source = Original email from CRUK | other_versions = | author = Cancer Res... | |
| 12:57, 30 July 2014 |  | 343 × 399 (145 KB) | Fæ | =={{int:filedesc}}== {{information | description = Diagram showing the lymph nodes lymphoma most commonly develops in. | date = {{ISOdate|2014-07-30}} (released by CRUK) | source = Original email from CRUK | other_versions = | author = Cancer Res... |
File usage
The following 3 pages use this file:
Global file usage
The following other wikis use this file: