
 French
 Deutsch
File:Froude numbers and waves.png
Original file (1,780 × 1,250 pixels, file size: 520 KB, MIME type: image/png)
| This is a file from the Wikimedia Commons. Information from its description page there is shown below. Commons is a freely licensed media file repository. You can help. |
Summary
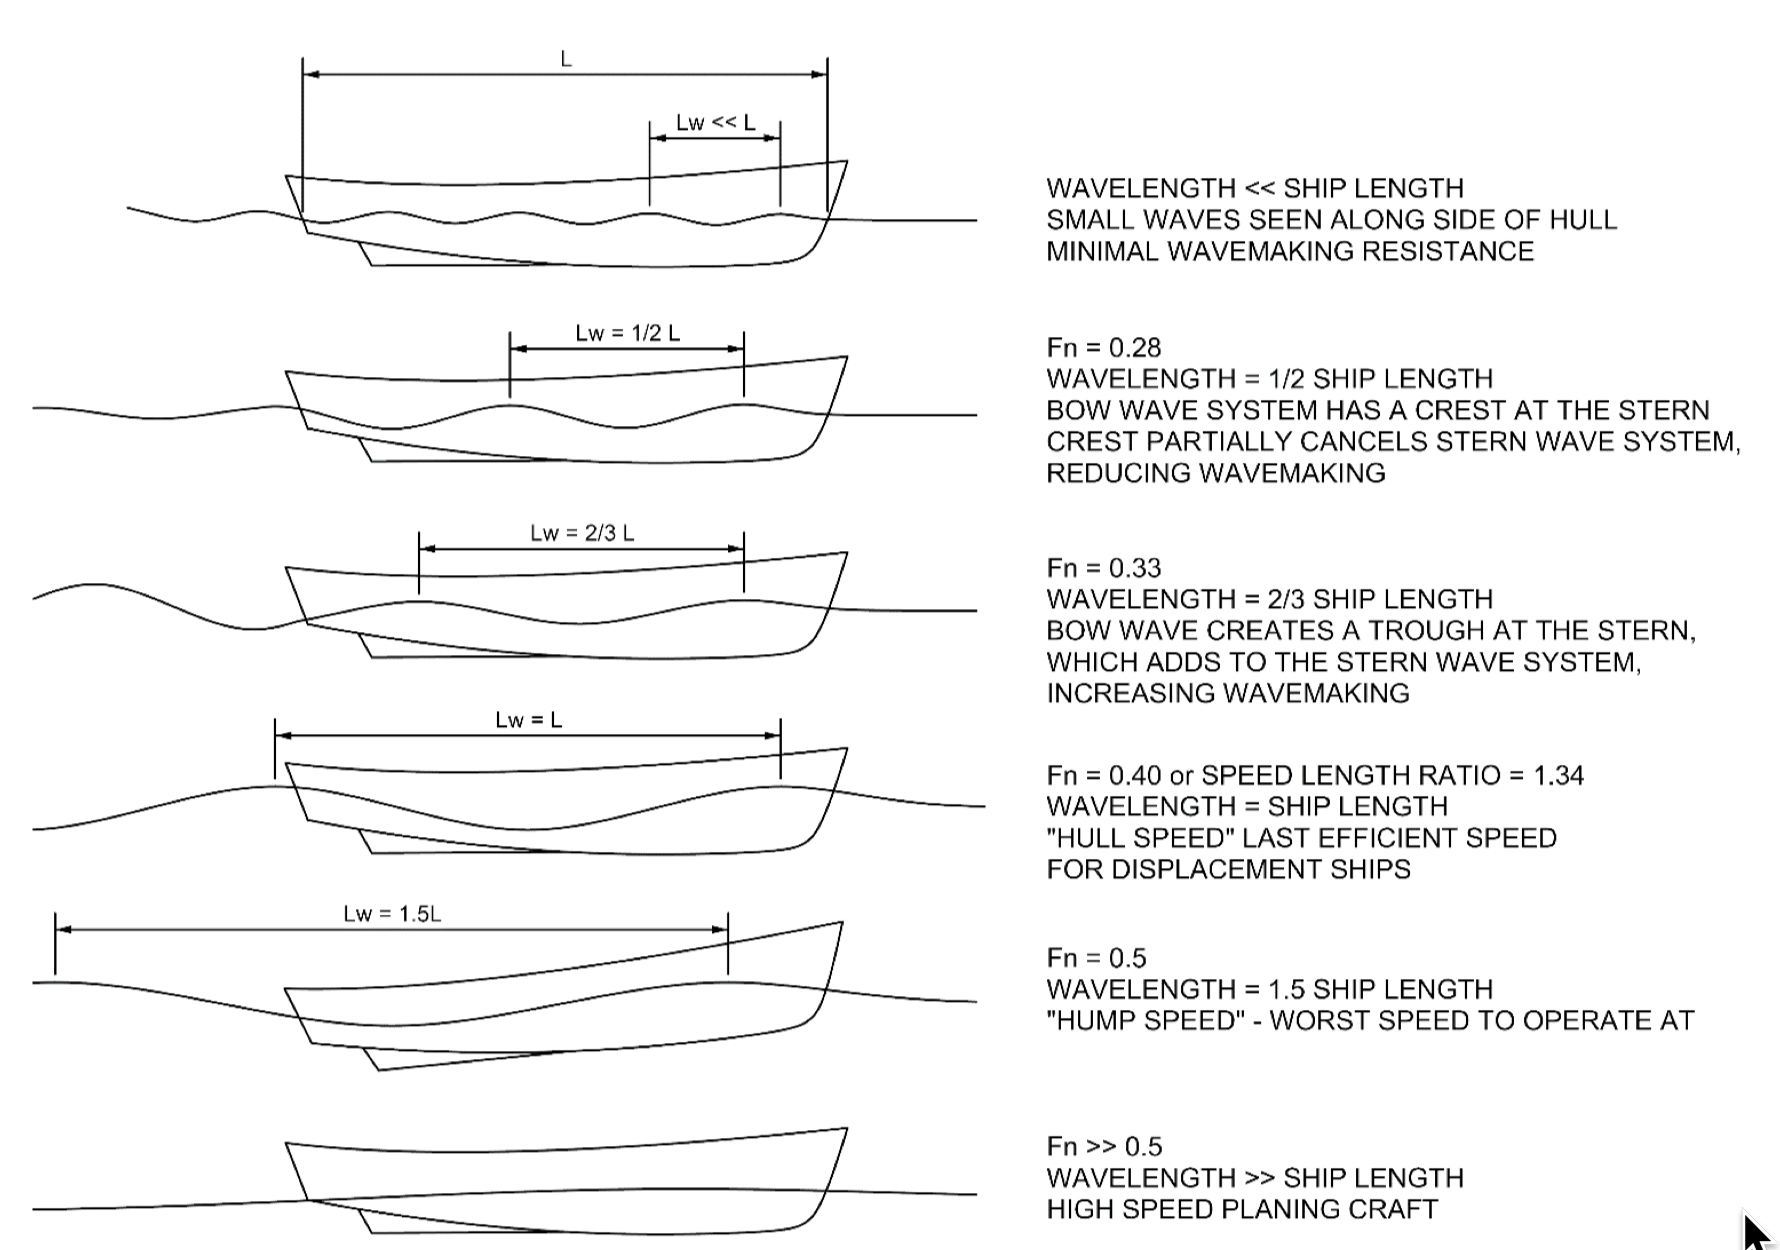
| Description | English: From the US Naval Academy Engineering 400 Class, Chapter 7. RESISTANCE AND POWERING OF SHIPS (P. 7-17): Figure 7.15 shows the appearance of the wave patterns along the side of the ship at various speeds. At low speeds, there are more wave crests on the side of the hull. At high speeds, the wavelength increases. The figure shows that at certain speeds, there is a crest at the stern, and at others, there is a trough. These crests and troughs can either partially cancel the stern wave system, or partially add to it, resulting in some speeds with higher resistance due to interference. This fact causes the plot of total resistance coefficient versus speed (Figure 7.16) to have “humps and hollows.” It is best to operate the ship in a hollow for fuel economy. The figure shows a large increase in resistance at a speed-to-length ratio of 1.34. This is the speed at which the wavelength is equal to the length of the ship. It is known as “hull speed,” which is the last efficient speed for a displacement ship. The speed where wavelength equals ship length can be solved for in the above equations and is: VS = 1.34 sqrt(LS) where: VS = ship speed (knots) LS = ship length (ft) Just above the “hull speed,” the stern of the ship drops into a large wave trough, and the ship runs at a high trim angle. Anyone who has been on a planing boat will have noticed a particular speed, where the bow comes up very high. This is the worst speed to operate at. As the boat goes faster, the wavelength increases still further, and the hull begins to plane, reducing wavemaking resistance. The plot in Figure 7.16 shows the great increase in resistance that occurs above hull speed, and also its drop at even higher speeds. Ships rarely have enough power to reach these speeds. |
| Date | |
| Source | https://www.usna.edu/NAOE/_files/documents/Courses/EN400/02.07%20Chapter%207.pdf |
| Author | US Naval Academy instructional staff |
Licensing
This work is in the public domain in the United States because it is a work prepared by an officer or employee of the United States Government as part of that person’s official duties under the terms of Title 17, Chapter 1, Section 105 of the US Code. Note: This only applies to original works of the Federal Government and not to the work of any individual U.S. state, territory, commonwealth, county, municipality, or any other subdivision. This template also does not apply to postage stamp designs published by the United States Postal Service since 1978. (See § 313.6(C)(1) of Compendium of U.S. Copyright Office Practices). It also does not apply to certain US coins; see The US Mint Terms of Use. |  | |
| This file has been identified as being free of known restrictions under copyright law, including all related and neighboring rights. | ||
File history
Click on a date/time to view the file as it appeared at that time.
| Date/Time | Thumbnail | Dimensions | User | Comment | |
|---|---|---|---|---|---|
| current | 15:02, 9 March 2019 | | 1,780 × 1,250 (520 KB) | HopsonRoad | User created page with UploadWizard |
File usage
The following page uses this file:
Global file usage
The following other wikis use this file:
- Usage on it.wikipedia.org