File:Heat eqn.gif

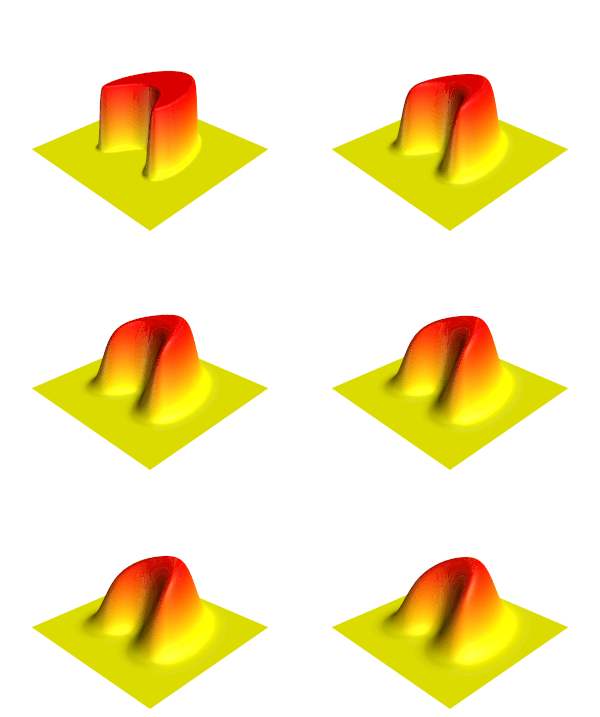
Heat_eqn.gif (200 × 136 pixels, file size: 500 KB, MIME type: image/gif, looped, 181 frames, 6.0 s)

Summary

Description
English: Illustration of the Heat equation.
Date (UTC)
Source Own work
 
This diagram was created with MATLAB.
Author Oleg Alexandrov
Other versions

Licensing

Public domain I, the copyright holder of this work, release this work into the public domain. This applies worldwide.
In some countries this may not be legally possible; if so:
I grant anyone the right to use this work for any purpose, without any conditions, unless such conditions are required by law.

MATLAB source code

% illustration of the heat equation % Solve the heat equation using finite differences and Forward Euler function main()      % the number of data points. More points means prettier picture.    N = 400;      L = 2.5; % the box size is [-L, L] x [-L, L]      XX = linspace(-L, L, N);    YY = linspace(-L, L, N);    [X, Y] = meshgrid(XX, YY);      scale = 2;    Z = get_step_function (N, scale, X, Y);      CFL = 0.125; % CourantFriedrichsLewy    dx = XX(2)-XX(1);  dy = dx; % space grid    dt = CFL*dx^2;      plot_dt = 0.004; % plot every plot_dt iterations     cmap = rv_matrix_rows(autumn); % colormap        % Solve the heat equation with zero boundary conditions    T = 0:dt:1;    iter = 0;    frame_no = 0;    for t=T         % plot the current temperature distribution       if floor(t/plot_dt) + 1 > frame_no            frame_no = frame_no + 1           % plot the surface          figure(2); clf;           surf(X, Y, Z);            %  make the surface beautiful          shading interp; colormap(cmap);             % add in a source of light          camlight (-50, 54);          lighting phong;            % viewing angle          view(-40, 38);            axis equal; axis off;          axis([-L, L, -L, L, 0, scale])            hold on; plot3(0, 0, 3.4, 'g*'); % a marker to help with cropping            pause(0.1);          %return            file = sprintf('Movie_frame%d.png', 1000+frame_no);          %saveas(gcf, file) %save the current frame          print(gcf, '-dpng', '-r400', file) %save the current frame            disp(file); %show the frame number we are at            % cut at max_fr_no frames          max_fr_no = 15;           if frame_no >= max_fr_no             break          end         end         % advance in time       W = 0*Z;       for i=2:(N-1)          for j=2:(N-1)               W(i, j) = Z(i, j) + dt * ( Z(i+1, j) + Z(i-1, j) + Z(i, j-1) + Z(i, j+1) - 4*Z(i, j))/dx^2;            end       end       Z = W;      end     % The gif image was creating with the command  % convert -antialias -loop 10000  -delay 20 -compress LZW Movie_frame10* Heat_eqn.gif    % get a function which is 1 on a set, and 0 outside of it function Z = get_step_function(N, scale, X, Y)      c = 2;    d=-1;    e=1;    f=0.5;    k=1.2;    shift=10;      Z = (c^2-(X/e-d).^2-(Y/f).^2).^2 + k*(c+d-X/e).^3-shift;      Z = 1-max(sign(Z), 0);    Z = scale*Z;  function X = rv_matrix_rows(X)     [m, n] = size(XL);     for i = 1:m       j = m + 1 - i;       if i < j          tmp = X(i, :); X(i, :) = X(j, :); X(j, :) = tmp;       end    end 

Captions

Add a one-line explanation of what this file represents

Items portrayed in this file

depicts

23 November 2007

image/gif

File history

Click on a date/time to view the file as it appeared at that time.

Date/TimeThumbnailDimensionsUserComment
current18:01, 2 February 2024Thumbnail for version as of 18:01, 2 February 2024200 × 136 (500 KB)Jahobrmore frames (by user Emil Dalalyan)
01:25, 12 April 2019Thumbnail for version as of 01:25, 12 April 2019200 × 136 (172 KB)Jorge StolfiDuplicated some framed at beginning so that readers can see the initial state. Added a couple blank frames at end to make it clear that the simulation ended. Slowed down the movie a bit.
19:58, 24 April 2011Thumbnail for version as of 19:58, 24 April 2011200 × 136 (116 KB)Oleg AlexandrovReverse the colormap (red is high).
06:11, 23 November 2007Thumbnail for version as of 06:11, 23 November 2007199 × 140 (126 KB)Oleg AlexandrovTweak, same license
05:51, 23 November 2007Thumbnail for version as of 05:51, 23 November 2007200 × 129 (112 KB)Oleg Alexandrov{{Information |Description=Illustration of the en:Heat equation |Source=self-made with Matlab |Date=~~~~~ |Author= Oleg Alexandrov |Permission=PD-self, see below |other_versions= }} {{PD-self}} ==MATLAB source code== <pre>

Global file usage

The following other wikis use this file: