
 French
 Deutsch
File:MLB runspergame history.svg

Size of this PNG preview of this SVG file: 640 × 480 pixels. Other resolutions: 320 × 240 pixels | 1,024 × 768 pixels | 1,280 × 960 pixels | 2,560 × 1,920 pixels.
Original file (SVG file, nominally 640 × 480 pixels, file size: 10 KB)
| This is a file from the Wikimedia Commons. Information from its description page there is shown below. Commons is a freely licensed media file repository. You can help. |
Summary
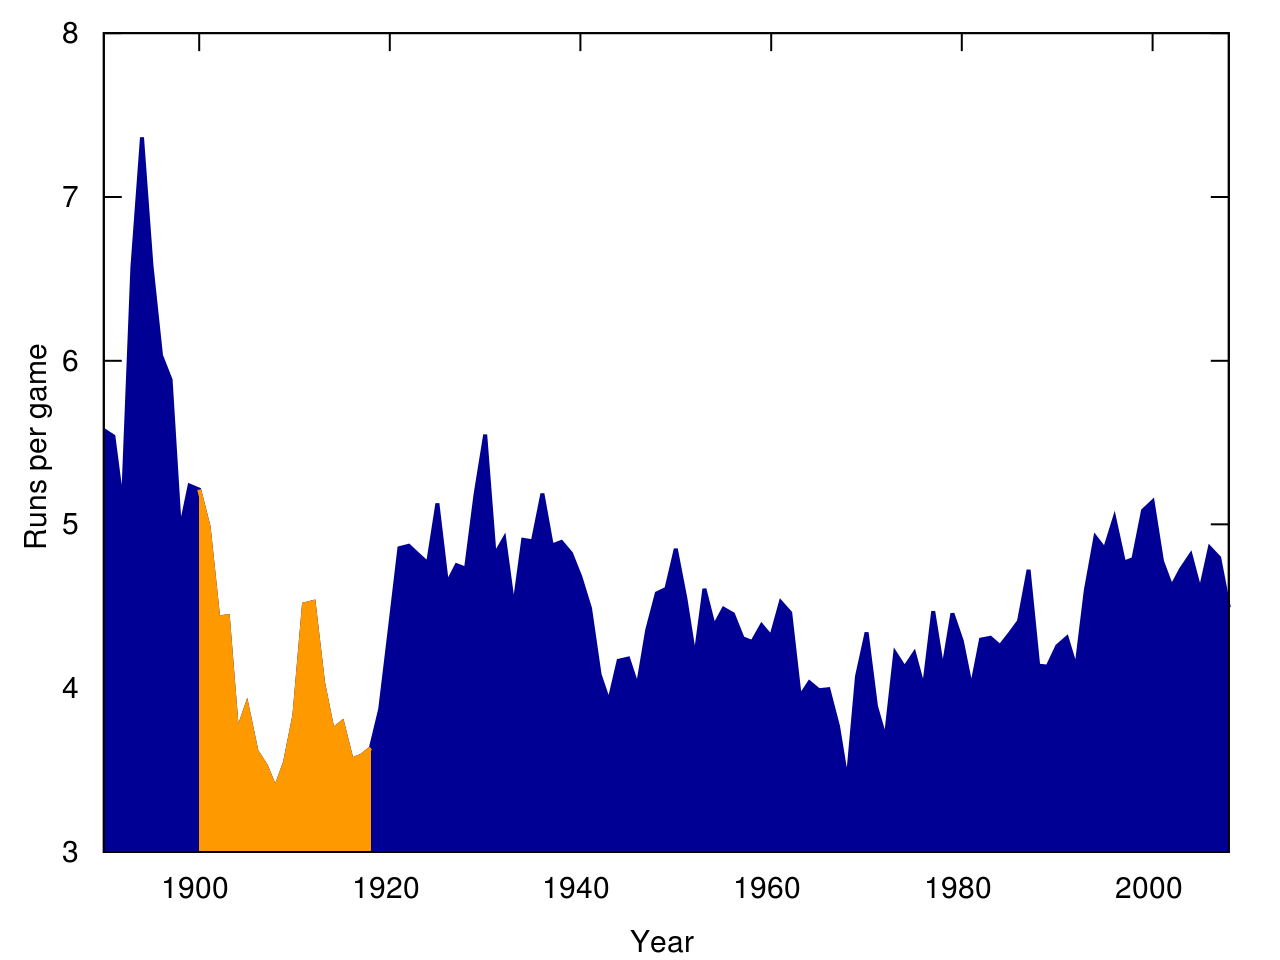
| Description | English: Historical major league baseball runs scored per game (by a single team); highlighted area is the "dead-ball" era, 1900-1918 inclusive. |
| Date | |
| Source | Own work |
| Author | Grabsomepine |
The data is league-wide; note that the American League data does not start until the creation of the American League in 1901.
Historical Major League Baseball data is freely available from many sources online. This data was taken from Baseball-Reference.com [1] [2]
The file was created in Gnuplot with the following code:
set terminal svg enhanced size 640 480 fname "Helvetica" fsize 12 set output "MLB_runspergame_history.svg" set style line 1 linetype 1 pointtype 6 linewidth 2 linecolor 6 pointsize 2 set style line 2 linetype 1 pointtype 6 linewidth 2 linecolor 7 pointsize 2 set xrange [1890:2008] set ytics 0,1,8 set yrange [3:8] set format y "%1.0f" set xlabel "Year" set ylabel "Runs per game" unset key set boxwidth 1.0 relative set style fill solid 1.0 plot \ "[datafile1] w filledcurves x1 linestyle 1,\ "[datafile2]" w filledcurves x1 linestyle 2
from the following data file:
Year R/G 1877 5.667 1876 5.896 1877 5.667 1878 5.174 1879 5.31 1880 4.693 1881 5.098 1882 5.41 1883 5.778 1884 5.501 1885 4.952 1886 5.237 1887 6.083 1888 4.538 1889 5.841 1890 5.575 1891 5.538 1892 5.097 1893 6.57 1894 7.363 1895 6.584 1896 6.032 1897 5.884 1898 4.956 1899 5.237 1900 5.213 1901 4.986 1902 4.432 1903 4.44 1904 3.726 1905 3.897 1906 3.617 1907 3.527 1908 3.385 1909 3.548 1910 3.835 1911 4.513 1912 4.527 1913 4.037 1914 3.745 1915 3.793 1916 3.564 1917 3.588 1918 3.634 1919 3.872 1920 4.361 1921 4.856 1922 4.87 1923 4.815 1924 4.761 1925 5.129 1926 4.637 1927 4.751 1928 4.73 1929 5.186 1930 5.549 1931 4.811 1932 4.913 1933 4.481 1934 4.906 1935 4.897 1936 5.188 1937 4.871 1938 4.893 1939 4.824 1940 4.68 1941 4.489 1942 4.083 1943 3.915 1944 4.168 1945 4.181 1946 4.007 1947 4.355 1948 4.579 1949 4.607 1950 4.852 1951 4.547 1952 4.176 1953 4.607 1954 4.376 1955 4.485 1956 4.452 1957 4.306 1958 4.283 1959 4.383 1960 4.314 1961 4.525 1962 4.461 1963 3.947 1964 4.036 1965 3.988 1966 3.994 1967 3.769 1968 3.418 1969 4.072 1970 4.342 1971 3.889 1972 3.686 1973 4.214 1974 4.125 1975 4.213 1976 3.995 1977 4.471 1978 4.103 1979 4.458 1980 4.288 1981 3.998 1982 4.298 1983 4.308 1984 4.257 1985 4.331 1986 4.409 1987 4.723 1988 4.138 1989 4.132 1990 4.256 1991 4.308 1992 4.117 1993 4.598 1994 4.923 1995 4.847 1996 5.036 1997 4.767 1998 4.79 1999 5.085 2000 5.14 2001 4.775 2002 4.618 2003 4.728 2004 4.814 2005 4.592 2006 4.858 2007 4.797 2008 4.493
Licensing
| I, the copyright holder of this work, release this work into the public domain. This applies worldwide. In some countries this may not be legally possible; if so: I grant anyone the right to use this work for any purpose, without any conditions, unless such conditions are required by law. |
File history
Click on a date/time to view the file as it appeared at that time.
| Date/Time | Thumbnail | Dimensions | User | Comment | |
|---|---|---|---|---|---|
| current | 05:21, 2 June 2008 | | 640 × 480 (10 KB) | Grabsomepine | {{Information |Description={{en|1=Historical runs scored per game (by both teams) in Major League Baseball.}} |Source=Own work by uploader |Author=Grabsomepine |Date=June 1, 2008 |Permission= |other_versions= }} Average of both Ameri |
File usage
The following pages on the English Wikipedia use this file (pages on other projects are not listed):
Global file usage
The following other wikis use this file:
- Usage on de.wikipedia.org
- Usage on ja.wikipedia.org