
 French
 Deutsch
File:Supercomputing-rmax-graph2.svg

Size of this PNG preview of this SVG file: 800 × 514 pixels. Other resolutions: 320 × 206 pixels | 640 × 411 pixels | 1,024 × 658 pixels | 1,280 × 823 pixels | 2,560 × 1,646 pixels | 1,260 × 810 pixels.
Original file (SVG file, nominally 1,260 × 810 pixels, file size: 60 KB)
| This is a file from the Wikimedia Commons. Information from its description page there is shown below. Commons is a freely licensed media file repository. You can help. |
Summary
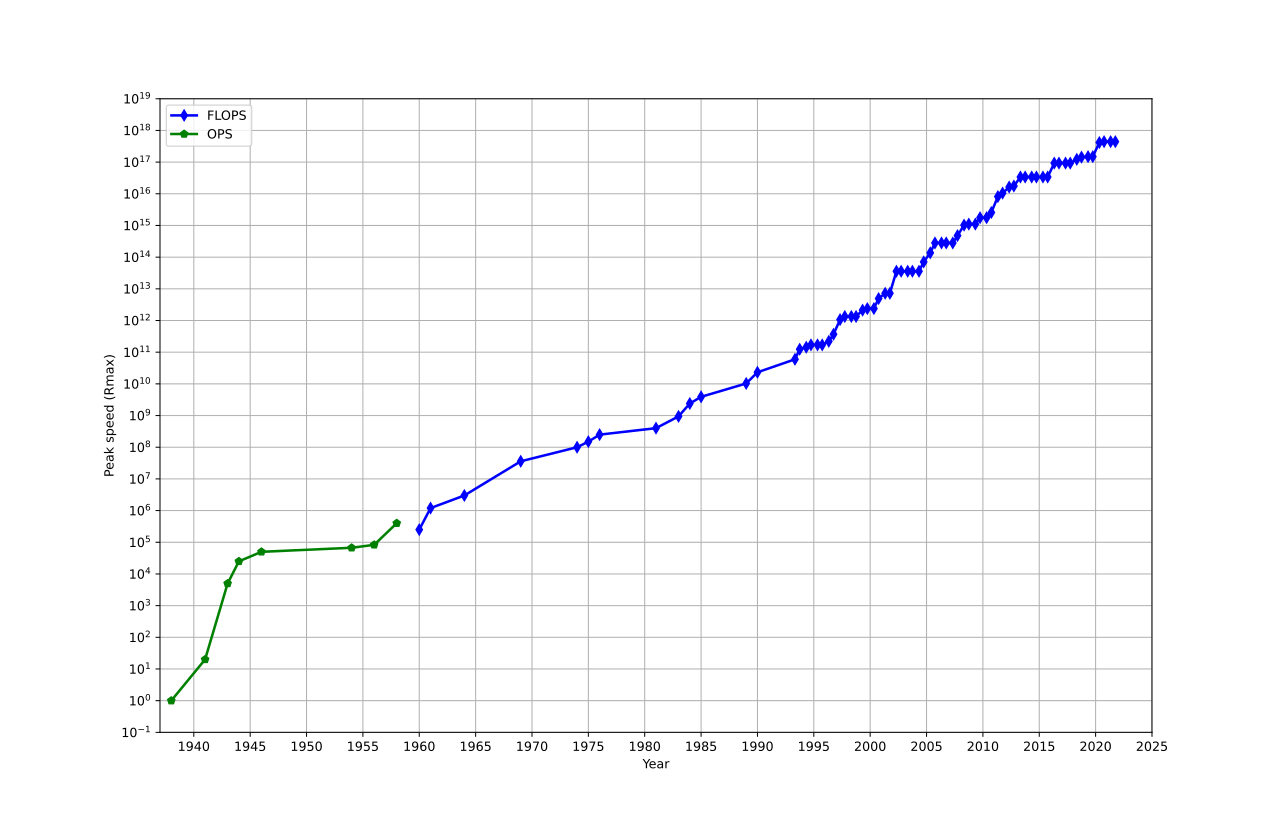
| Description | English: Plot of highest supercomputer performance over time |
| Date | |
| Source | Own work |
| Author | Morn |
| Other versions |
|

Licensing
I, the copyright holder of this work, hereby publish it under the following license:
| This file is made available under the Creative Commons CC0 1.0 Universal Public Domain Dedication. | |
| The person who associated a work with this deed has dedicated the work to the public domain by waiving all of their rights to the work worldwide under copyright law, including all related and neighboring rights, to the extent allowed by law. You can copy, modify, distribute and perform the work, even for commercial purposes, all without asking permission.
|
Python source code
#!/usr/bin/env python3 from pylab import * # uses Matplotlib import matplotlib.dates as mdates import datetime # Data from HTML source at http://top500.org/statistics/perfdevel/ # and https://en.wikipedia.org/w/index.php?title=Supercomputer&oldid=380073785 li = """ 1938,1 1941,20 1943,5000 1944,25000 1946,50000 1954,67000 1956,83000 1958,400000 1960,250000 1961,1.2 1964,3 1969,36 1974,100 1975,150 1976,250 1981,400 1983,941 1984,2.4 1985,3.9 1989,10.3 1990,23.2 1993-05-01,59.7,0.42,1128.57 1993-10-01,124,0.47,1493.35 1994-05-01,143.4,0.84,2317.01 1994-10-01,170,1.16,2732.24 1995-05-01,170,1.96,3927 1995-10-01,170,2.49,4784.34 1996-05-01,220.4,3.31,5892.24 1996-10-01,368.2,4.62,7981.24 1997-05-01,1068,7.67,12844.19 1997-10-01,1338,9.51,16898.12 1998-05-01,1338,13.39,22625.14 1998-10-01,1338,17.12,29367.6 1999-05-01,2121,24.7,39062.57 1999-10-01,2379,33.09,50938.56 2000-05-01,2379,43.82,64230.11 2000-10-01,4938,55.3,88082.45 2001-05-01,7226,67.78,108276.78 2001-10-01,7226,94.3,134977.51 2002-05-01,35860,134.3,222263.77 2002-10-01,35860,195.8,291814.16 2003-05-01,35860,241.4,370049.26 2003-10-01,35860,378.6,526740.41 2004-05-01,35860,606.9,812313.21 2004-10-01,70720,840.02,1128834.52 2005-05-01,136800,1166,1694886.64 2005-10-01,280600,1645.7,2299341.68 2006-05-01,280600,2026,2789465.47 2006-10-01,280600,2736.9,3527867.61 2007-05-01,280600,4031,4950600.48 2007-10-01,478200,5937.33,6977593.51 2008-05-01,1026000,8996.78,12152691.08 2008-10-01,1105000,12593.5,17373520.05 2009-05-01,1105000,17110,22640789.57 2009-10-01,1759000,20070,28006450.09 2010-05-01,1759000,24670,32434684.56 2010-10-01,2566000,31124.36,43786881.73 2011-05-01,8162000,40187.29,58930025.84 2011-10-01,10510000,50941.4,74069633.68 2012-05-01,16324751,60824.4,123417786.71 2012-10-01,17590000,76411,162139386.75 2013-05-01,33862700,96619,223654338.13 2013-10-01,33862700,117831.30,250080467.17 2014-05-01,33862700,133700,273763781.09 2014-10-01,33862700,153381,308850512.09 2015-05-01,33862700.00,164559,359296049.36 2015-10-01,33862700.00,206304,417807043.60 2016-05-01,93014593.88,286100,567353038.81 2016-10-01,93014593.88,349333,672112377.49 2017-05-01,93014593.88,432200,748700301.81 2017-10-01,93014593.88,548672,845120504.67 2018-05-01,122300000.00,715551,1210914864.08 2018-10-01,143500000.00,874800,1414955581.78 2019-05-01,148600000,1021000,1559575379.78 2019-10-01,148600000,1142000,1646887142.78 2020-05-01,415530000,1228000,2206134393.77 2020-10-01,442010000,1316840,2428761851.77 2021-05-01,442010000,1511000,2786058799.77 2021-10-01,442010000,1649110,3036861783.77 """ x1, y1, x2, y2 = [], [], [], [] for line in li.splitlines(): if ',' not in line: continue e = line.split(',') if '-' not in e[0]: m,d = 1,1 y = int(e[0]) else: y, m, d = [int(w) for w in e[0].split('-')] f = float(e[1]) if y > 1983: mult = 1e9 elif y > 1960: mult = 1e6 else: mult = 1 if y < 1960: y2.append(mult*f) x2.append(datetime.date(y, m, d)) else: y1.append(mult*f) x1.append(datetime.date(y, m, d)) figure(figsize=(14,9)) semilogy(x1, y1, label = "FLOPS", lw = 2, color = "blue", marker = "d") semilogy(x2, y2, label = "OPS", lw = 2, color = "green", marker = "p") legend(loc = "upper left") xlabel('Year') ylabel('Peak speed (Rmax)') grid('on') xticks([datetime.date(y,1,1) for y in range(1935, 2040, 5)]) yticks([10**q for q in range(-1, 20)]) axis((datetime.date(1937,1,1), datetime.date(2025,1,1), .1, 1e19)) ax = gca() ax.xaxis.set_major_formatter(mdates.ConciseDateFormatter(ax.xaxis.get_major_locator())) savefig("Supercomputing-rmax-graph.svg") show() File history
Click on a date/time to view the file as it appeared at that time.
| Date/Time | Thumbnail | Dimensions | User | Comment | |
|---|---|---|---|---|---|
| current | 13:16, 24 March 2022 | | 1,260 × 810 (60 KB) | Morn | updated |
| 22:36, 14 January 2019 |  | 1,260 × 810 (55 KB) | Morn | updated | |
| 10:29, 28 July 2015 |  | 1,260 × 810 (62 KB) | Morn | updated | |
| 12:46, 14 December 2014 |  | 1,260 × 810 (62 KB) | Morn | updated | |
| 11:48, 11 May 2014 |  | 1,260 × 810 (62 KB) | Morn | {{Information |Description ={{en|1=Plot of highest supercomputer performance over time}} |Source ={{own}} |Author =Morn |Date =2014-05-11 |Permission = |other_versions = }} [[Category:History of computing... |
File usage
The following pages on the English Wikipedia use this file (pages on other projects are not listed):
Global file usage
The following other wikis use this file:
- Usage on ca.wikipedia.org
- Usage on fr.wikipedia.org
- Usage on hi.wikipedia.org
- Usage on sw.wikipedia.org