Hypoxia (environmental)

| Part of a series on |
| Pollution |
|---|
 |
Hypoxia (hypo: "below", oxia: "oxygenated") refers to low oxygen conditions. For air-breathing organisms, hypoxia is problematic. But for many anaerobic organisms, hypoxia is essential. Hypoxia applies to many situations, but usually refers to the atmosphere and natural waters.[3]
Atmospheric hypoxia
[edit]Atmospheric hypoxia occurs naturally at high altitudes. Total atmospheric pressure decreases as altitude increases, causing a lower partial pressure of oxygen, which is defined as hypobaric hypoxia. Oxygen remains at 20.9% of the total gas mixture, differing from hypoxic hypoxia, where the percentage of oxygen in the air (or blood) is decreased. This is common in the sealed burrows of some subterranean animals, such as blesmols.[4] Atmospheric hypoxia is also the basis of altitude training, which is a standard part of training for elite athletes. Several companies mimic hypoxia using normobaric artificial atmosphere.
Aquatic hypoxia
[edit]An aquatic system lacking dissolved oxygen (0% saturation) is termed anaerobic, reducing, or anoxic.
In water, oxygen levels are approximately 7 ppm or 0.0007% in good quality water, but fluctuate.[5] Many organisms require hypoxic conditions. Oxygen is poisonous to anaerobic bacteria for example.[3]
Oxygen depletion is typically expressed as a percentage of the oxygen that would dissolve in the water at the prevailing temperature and salinity. A system with low concentration—in the range between 1 and 30% saturation—is called hypoxic or dysoxic. Most fish cannot live below 30% saturation since they rely on oxygen to derive energy from their nutrients. Hypoxia leads to impaired reproduction of remaining fish via endocrine disruption.[6] A "healthy" aquatic environment should seldom experience less than 80% saturation. The exaerobic zone is found at the boundary of anoxic and hypoxic zones.
Hypoxia can occur throughout the water column and also at high altitudes as well as near sediments on the bottom. It usually extends throughout 20-50% of the water column, but depends on the water depth and location of pycnoclines (rapid changes in water density with depth). It can occur in 10-80% of the water column. For example, in a 10-meter water column, it can reach up to 2 meters below the surface. In a 20-meter water column, it can extend up to 8 meters below the surface.[7]
Seasonal kill
[edit]Hypolimnetic oxygen depletion can lead to both summer and winter "kills". During summer stratification, inputs or organic matter and sedimentation of primary producers can increase rates of respiration in the hypolimnion. If oxygen depletion becomes extreme, aerobic organisms, like fish, may die, resulting in what is known as a "summer kill".[8] The same phenomena can occur in the winter, but for different reasons. During winter, ice and snow cover can attenuate light, and therefore reduce rates of photosynthesis. The freezing over of a lake also prevents air-water interactions that allow the exchange of oxygen. This creates a lack of oxygen while respiration continues. When the oxygen becomes badly depleted, anaerobic organisms can die, resulting in a "winter kill".[8]
Causes of hypoxia
[edit]
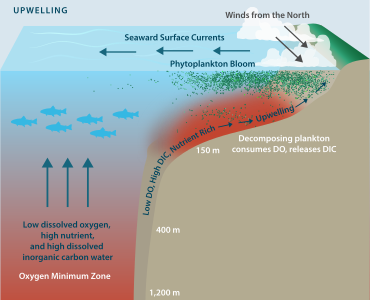
Oxygen depletion can result from a number of natural factors, but is most often a concern as a consequence of pollution and eutrophication in which plant nutrients enter a river, lake, or ocean, and phytoplankton blooms are encouraged. While phytoplankton, through photosynthesis, will raise DO saturation during daylight hours, the dense population of a bloom reduces DO saturation during the night by respiration. When phytoplankton cells die, they sink towards the bottom and are decomposed by bacteria, a process that further reduces DO in the water column. If oxygen depletion progresses to hypoxia, fish kills can occur and invertebrates like worms and clams on the bottom may be killed as well.

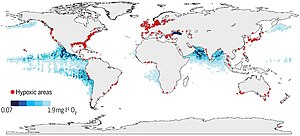
Hypoxia may also occur in the absence of pollutants. In estuaries, for example, because freshwater flowing from a river into the sea is less dense than salt water, stratification in the water column can result. Vertical mixing between the water bodies is therefore reduced, restricting the supply of oxygen from the surface waters to the more saline bottom waters. The oxygen concentration in the bottom layer may then become low enough for hypoxia to occur. Areas particularly prone to this include shallow waters of semi-enclosed water bodies such as the Waddenzee or the Gulf of Mexico, where land run-off is substantial. In these areas a so-called "dead zone" can be created. Low dissolved oxygen conditions are often seasonal, as is the case in Hood Canal and areas of Puget Sound, in Washington State.[9] The World Resources Institute has identified 375 hypoxic coastal zones around the world, concentrated in coastal areas in Western Europe, the Eastern and Southern coasts of the US, and East Asia, particularly in Japan.[10]

Hypoxia may also be the explanation for periodic phenomena such as the Mobile Bay jubilee, where aquatic life suddenly rushes to the shallows, perhaps trying to escape oxygen-depleted water. Recent widespread shellfish kills near the coasts of Oregon and Washington are also blamed on cyclic dead zone ecology.[11]
Phytoplankton breakdown
[edit]Phytoplankton are mostly made up of lignin and cellulose, which are broken down by oxidative mechanism, which consume oxygen. [12]
Environmental factors
[edit]
The breakdown of phytoplankton in the environment depends on the presence of oxygen, and once oxygen is no longer in the bodies of water, ligninperoxidases cannot continue to break down the lignin. When oxygen is not present in the water, the time required for breakdown of phytoplankton changes from 10.7 days to a total of 160 days.
The rate of phytoplankton breakdown can be represented using this equation:
In this equation, G(t) is the amount of particulate organic carbon (POC) overall at a given time, t. G(0) is the concentration of POC before breakdown takes place. k is a rate constant in year-1, and t is time in years. For most POC of phytoplankton, the k is around 12.8 years-1, or about 28 days for nearly 96% of carbon to be broken down in these systems. Whereas for anoxic systems, POC breakdown takes 125 days, over four times longer.[15] It takes approximately 1 mg of oxygen to break down 1 mg of POC in the environment, and therefore, hypoxia takes place quickly as oxygen is used up quickly to digest POC. About 9% of POC in phytoplankton can be broken down in a single day at 18 °C. Therefore, it takes about eleven days to completely break down phytoplankton.[16]
After POC is broken down, this particulate matter can be turned into other dissolved carbon, such as carbon dioxide, bicarbonate ions, and carbonate. As much as 30% of phytoplankton can be broken down into dissolved carbon. When this particulate organic carbon interacts with 350 nm ultraviolet light, dissolved inorganic carbon is formed, removing even more oxygen from the environment in the forms of carbon dioxide, bicarbonate ions, and carbonate. Dissolved inorganic carbon is made at a rate of 2.3–6.5 mg/(m3⋅day).[17]
As phytoplankton breakdown, free phosphorus and nitrogen become available in the environment, which also fosters hypoxic conditions. As the breakdown of this phytoplankton takes place, the more phosphorus turns into phosphates, and nitrogens turn into nitrates. This depletes the oxygen even more so in the environment, further creating hypoxic zones in higher quantities. As more minerals such as phosphorus and nitrogen are displaced into these aquatic systems, the growth of phytoplankton greatly increases, and after their death, hypoxic zones are formed.[18]
See also
[edit]- Algal blooms
- Anoxic event
- Dead zone (ecology)
- Cyanobacterial bloom
- Denitrification
- Eutrophication
- Hypoxia in fish
- Oxygen minimum zone
References
[edit]- ^ Breitburg, D., Levin, L. A., Oschlies, A., Gregoire, M., Chavez, F. P., and Conley, D. J. (2018) "Declining oxygen in the global ocean and coastal waters". Science, 359: eaam7240. doi:10.1126/science.aam7240.
- ^ Benway, H.M., Lorenzoni, L., White, A.E., Fiedler, B., Levine, N.M., Nicholson, D.P., DeGrandpre, M.D., Sosik, H.M., Church, M.J., O'Brien, T.D. and Leinen, M. (2019) "Ocean time series observations of changing marine ecosystems: an era of integration, synthesis, and societal applications", Frontiers in Marine Science, 6(393). doi:10.3389/fmars.2019.00393.
- ^ a b Diaz, Robert J.; Rosenberg, Rutger (2008). "Spreading Dead Zones and Consequences for Marine Ecosystems". Science. 321 (5891): 926–929. Bibcode:2008Sci...321..926D. doi:10.1126/science.1156401. PMID 18703733. S2CID 32818786.
- ^ Roper, T.J.; et al. (2001). "Environmental conditions in burrows of two species of African mole-rat, Georychus capensis and Cryptomys damarensis". Journal of Zoology. 254 (1): 101–07. doi:10.1017/S0952836901000590.
- ^ "Dissolved Oxygen". Water Quality. Water on the Web. Archived from the original on 13 December 2012. Retrieved 21 December 2012.
- ^ Wu, R. et al. 2003. Aquatic Hypoxia Is an Endocrine Disruptor and Impairs Fish Reproduction
- ^ Rabalais, Nancy; Turner, R. Eugene; Justic´, Dubravko; Dortch, Quay; Wiseman, William J. Jr. Characterization of Hypoxia: Topic 1 Report for the Integrated Assessment on Hypoxia in the Gulf of Mexico. Ch. 3. NOAA Coastal Ocean Program, Decision Analysis Series No. 15. May 1999. < http://oceanservice.noaa.gov/products/hypox_t1final.pdf >. Retrieved February 11, 2009.
- ^ a b Wetzel, R. G. (2001). Limnology: Lake and river ecosystems. San Diego: Academic Press.
- ^ Encyclopedia of Puget Sound: Hypoxia http://www.eopugetsound.org/science-review/section-4-dissolved-oxygen-hypoxia
- ^ Selman, Mindy (2007) Eutrophication: An Overview of Status, Trends, Policies, and Strategies. World Resources Institute.
- ^ oregonstate.edu Archived 2006-09-01 at the Wayback Machine – Dead Zone Causing a Wave of Death Off Oregon Coast (8/9/2006)
- ^ Gubernatorova, T. N.; Dolgonosov, B. M. (2010-05-01). "Modeling the biodegradation of multicomponent organic matter in an aquatic environment: 3. Analysis of lignin degradation mechanisms". Water Resources. 37 (3): 332–346. Bibcode:2010WRes...37..332G. doi:10.1134/S0097807810030085. ISSN 0097-8078. S2CID 98068128.
- ^ Chan, F., Barth, J.A., Kroeker, K.J., Lubchenco, J. and Menge, B.A. (2019) "The dynamics and impact of ocean acidification and hypoxia". Oceanography, 32(3): 62–71. doi:10.5670/oceanog.2019.312.
 Material was copied from this source, which is available under a Creative Commons Attribution 4.0 International License.
 - ^ Gewin, V. (2010) "Oceanography: Dead in the water". Nature, 466(7308): 812. doi:10.1038/466812a.
- ^ Harvey, H. Rodger (1995). "Kinetics of phytoplankton decay during simulated sedimentation: Changes in biochemical composition and microbial activity under oxic and anoxic conditions". Geochimica et Cosmochimica Acta. 59 (16): 3367–77. Bibcode:1995GeCoA..59.3367H. doi:10.1016/0016-7037(95)00217-n.
- ^ Jewell, William J. (1971). "Aquatic Weed Decay: Dissolved Oxygen Utilization and Nitrogen and Phosphorus Regeneration". Journal. 43 (7). Water Pollution Control Federation: 1457–67. PMID 5568364.
- ^ Johannessen, Sophia C.; Peña, M. Angelica; Quenneville, Melanie L. (2007). "Photochemical production of carbon dioxide during a coastal phytoplankton bloom". Estuarine, Coastal and Shelf Science. 73 (1–2): 236–42. Bibcode:2007ECSS...73..236J. doi:10.1016/j.ecss.2007.01.006.
- ^ Conley, Daniel J.; Paerl, Hans W.; Howarth, Robert W.; Boesch, Donald F.; Seitzinger, Sybil P.; Havens, Karl E.; Lancelot, Christiane; Likens, Gene E. (2009-02-20). "Controlling Eutrophication: Nitrogen and Phosphorus". Science. 323 (5917): 1014–15. doi:10.1126/science.1167755. ISSN 0036-8075. PMID 19229022. S2CID 28502866.
Sources
[edit]- Kils, U., U. Waller, and P. Fischer (1989). "The Fish Kill of the Autumn 1988 in Kiel Bay". International Council for the Exploration of the Sea. C M 1989/L:14.
{{cite journal}}: CS1 maint: multiple names: authors list (link) - Fischer P.; U. Kils (1990). "In situ Investigations on Respiration and Behaviour of Stickleback Gasterosteus aculeatus and the Eelpout Zoaraes viviparus During Low Oxygen Stress". International Council for the Exploration of the Sea. C M 1990/F:23.
- Fischer P.; K. Rademacher; U. Kils (1992). "In situ investigations on the respiration and behaviour of the eelpout Zoarces viviparus under short term hypoxia". Mar Ecol Prog Ser. 88: 181–84. Bibcode:1992MEPS...88..181F. doi:10.3354/meps088181.


 French
 Deutsch

